Key takeaways:
- Risk parity techniques, which use leverage to generate a warranted exposure to bond risk, have provoked a mixed reaction from investors
- Leverage ensures that bond allocations remain meaningful and ultimately facilitates portfolio diversification
- Risk management techniques can be applied to mitigate the undesirable effects of leveraged bonds during weaker bond markets
Risk parity: A bit marmite
According to Wikipedia, Marmite is a yeast extract spread created in 1902 by German scientist Justus von Liebig from beer-brewing by-products. The Oxford English Dictionary states that, ‘marmite’, when used as an adjective, is colloquial for ‘something that polarises opinions by provoking either strongly positive or strongly negative reactions rather than indifference’.
In our experience, risk parity strategies – which allocate risk evenly across the different asset classes in the portfolio – are often perceived as ‘marmite’. Proponents appreciate the diversification the strategies offer. We recently outlined the premise underpinning risk parity strategies, but here we delve specifically into the detractors’ case, to see whether the strategies are as unpalatable as they make out.
60/40: Thinly spread bonds
The ubiquitous 60/40 portfolio has a whiff of balance about it: 60% notional exposure to equities and 40% notional exposure to bonds. Of course, the higher historic volatility of equities over bonds means that 60/40 is effectively a bet on equities. Using the same dataset as that examined in our former article, 60/40 in 2020 vision, Figure 1 shows that 60/40 is more like 80/20 in risk terms (middle plot), given the higher volatility of global stocks compared to global bonds over the last 30 years. It is perhaps unsurprising then that 60/40 has a correlation of 0.99 to equities over the same time period.
Problems loading this infographic? - Please click here
For it to have any material impact on a portfolio, a bond allocation needs to be meaningful. Risk-parity approaches are predicated on the equality of long-term risk-adjusted returns and by examining the Sharpe ratios of global stocks and bonds over multi-decade time horizons, as we do in Figure 2, an equal risk approach does appear justified; over the longest time horizons, bond and equity Sharpe ratios are similar. Less so over the last decade, but more on that later...
Problems loading this infographic? - Please click here
Of course, an equal risk approach, as illustrated on the right-hand side of Figure 1, and justified by Figure 2, gives rise to an exposure profile which varies over time, as exhibited in Figure 3.
Problems loading this infographic? - Please click here
Here, our simulated portfolio targets 10% return volatility overall, using a three-year lookback, which is about the same as 60/40 in the long-term. It is worth highlighting here that for the risk parity portfolio:
1. We have introduced leverage
2. This leverage is mainly to afford the amount of bonds required
3. Leverage is dynamic – it tends to be high when volatility in markets is low, and vice versa
4. The amount of bonds required to maintain the same level of risk has decreased in the last five years amid a period of heightened volatility
We can see where the accusation that ‘risk parity is just levered bonds’ comes from. Note, however, that leverage is simply facilitating diversification, not adding to risk. As Figure 3 also illustrates, the realised volatility of our risk parity portfolio is arguably better constrained than 60/40’s. We discussed this concept in greater depth in an earlier paper.
Learning to love levered bonds
Figure 3 illustrates how risk parity portfolios have levered bonds, not because this is bad, per se, but just to make the bond allocation meaningful. But under what circumstances might investors be unhappy about this? We need to look back no further than the last decade to answer this. The risk-adjusted returns of bonds have been close to zero (Figure 2)
Our hypothetical risk-parity strategy has significantly underperformed 60/40 in the last decade because the Sharpe ratio of equities has vastly exceeded the Sharpe ratio of bonds. But then again, 60/40 has significantly underperformed a 100% equity portfolio. Equities has been the place to be. TINA1 , indeed.
The purpose of this article is not to argue which will do better going forward. In fact, we have consistently stated that returns are incredibly hard to predict. What we do believe is that risk is predictable, and improved risk-adjusted returns can be achieved by concentrating on the denominator rather than the numerator. Specifically, we are focused on three areas of risk predictability:
- Volatility targeting: counters persistent fluctuations in volatility by dynamically scaling up the portfolio at times of low volatility, and scaling down at times of high volatility
- Momentum overlays: these reduce the exposure to assets that are in a downward trend, i.e., ‘don’t fight the bear market’
- Bond / equity correlation trigger: degearing the portfolio when there is a risk that a bond-driven sell-off spills over into equities
In Figure 4, we show the results of deploying these techniques on a globally diversified portfolio of bonds as part of a risk parity portfolio, targeting 10% return volatility, and with 25% risk allocated to bonds. Note how bond attribution is positive despite global bonds performing negatively over the period - and the portfolio’s bond allocation being almost twice as large as the bond allocation in 60/40 (75% versus 40%).
Figure 4. Risk parity bonds versus a static 60/40 bond allocation
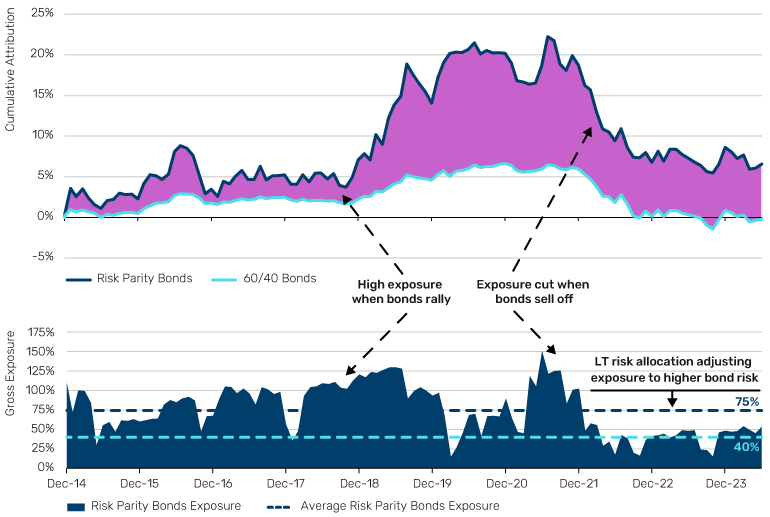
Source: Man Group Database. Past performance is not indicative of future returns. Data to end H1 2024.
Parting comments
We have argued that levered bonds are necessary to give sufficient exposure to bonds in risk-parity and multi-asset portfolios. The unwanted effect of this, during bond sell-offs, may be mitigated through risk management techniques.
The arguments outlined in this note are not based on the predictability of returns; our risk allocations are set according to long-term assumptions of equality, and risk management is carried out using systematic techniques based on market observables. Nevertheless, as we have previously pointed out , it stands to reason that on a forward-looking basis, bonds offer better value and more appeal, all-things-being-equal, at 4% yield rather than 1%.
1.Source: https://www.invest opedia.com/terms/t/tina-there-no-alternative.asp
Bibliography
Abou Zeid,. T. (2022), “Leverage Does Not Equal Risk”, Man Institute, Available at: https://www.man.com/maninstitute/leverage-equal-risk
Hoyle, E, Abou Zeid, T. (2023) “Bonds: Shaken, but Not Stirred”, Man Institute, Availalble at https://www.man.com/maninstitute/bonds-shaken-but-not-stirred
Hoyle, E. (2024), “Risky Business: Why the Smart Money Forecasts Risk, Not Returns”, Man Institute, Available at: https://www.man.com/maninstitute/risky-business-why-the-smart
Korgaonkar, R., Robertson, G. (2021), “We See Risk Where Others May Not: Active Risk Management in Practice”, Man Institute, Available at: https://www.man.com/maninstitute/active-risk-management-in-practice
Korgaonkar, R., Robertson, G. (2023), “Dial Up Return, Not Risk: The Z-Shift Framework”, Man Institute, Available at https://www.man.com/maninstitute/z-shift-framework-empirical-evaluation
Robertson, G. (2022), “No More Horses! The Predictability of Returns and Risk, and Their Use in Asset Management”, Man Institute, Available at: https://www.man.com/maninstitute/no-more-horses
Robertson, G. (2020), “60:40 in 20:20 Vision”, Man Institute, Available at: https://www.man.com/maninstitute/60-40-in-2020-vision
You are now leaving Man Group’s website
You are leaving Man Group’s website and entering a third-party website that is not controlled, maintained, or monitored by Man Group. Man Group is not responsible for the content or availability of the third-party website. By leaving Man Group’s website, you will be subject to the third-party website’s terms, policies and/or notices, including those related to privacy and security, as applicable.