This is an excerpt from a chapter in ‘Portfolio Construction Management: Innovation and Challenges in the Digital Age’, published in January 2021.
Introduction
Academic studies have shown that risk is more predictable than returns. Traditional ‘60/40’ portfolios, however, focus on return expectations through the allocation of notional capital rather than risk.
We have previously written about how it is possible to build portfolios using tried-andtested risk management techniques that have similar risk characteristics to traditional portfolios, but with improved returns. Termed the ‘Z-shift’ because of the figure drawn in risk-return space, the technique makes use of diversification, capital efficiency and risk management overlays.
In this article, we focus on the third part of the Z-shift: the risk management overlays.
The Z-Shift: A Recap
In the Z-shift, the route from the traditional 60/40 portfolio to what is, in our view, a more optimal portfolio, is as follows:
- Step 1: Diversification
Classic finance theory tells us that diversification improves expected risk-return. The first step of the Z-shift is moving from the 60/40 portfolio to the more diversified portfolio (Figure 1) with the highest Sharpe ratio among unlevered efficient frontier investments, as measured by the slope of the line connecting it to the T-bill investment. Diversifying lowers risk, but can also reduce expected returns; - Step 2: Capital Efficiency
This reduction can be countered through the use of cash efficient instruments such as futures. A diversified portfolio can then be scaled up to achieve the desired return, taking us outside the efficient frontier and scaling up risk in the process; - Step 3: Risk Management
But we can still do better, by dynamically risk managing the portfolio using techniques common among active managers like hedge funds, but often underutilised by others. Such techniques monitor the risk landscape in real-time, and rely upon an advanced execution platform to adapt positions in a timely manner should risks change.
Figure 1. Three Stages of the Z-Shift
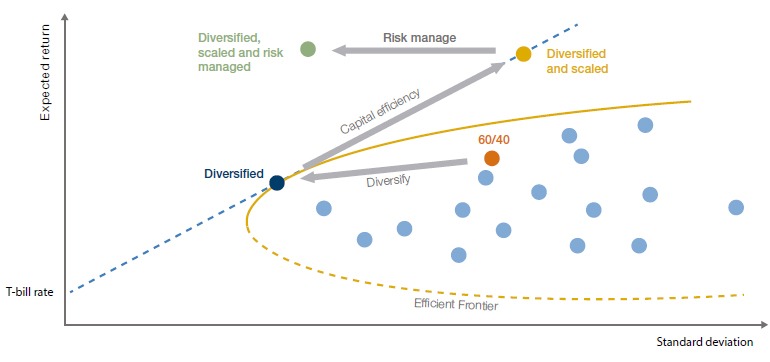
Source: Man Group. For illustrative purposes only.
Active Risk Management in Practice
Three categories of risk mitigating techniques can be employed: volatility targeting, momentum overlays and bond / equity correlation trigger.
Three categories of risk mitigating techniques can be employed:
- Volatility targeting: counters persistent fluctuations in volatility by dynamically scaling up the portfolio at times of low volatility, and scaling down at times of high volatility;
- Momentum overlays: these reduce the exposure to assets that are in a downward trend, i.e., ‘don’t fight the bear market’;
- Bond / equity correlation trigger: degears the portfolio when there is the risk that a bond-driven sell-off spills over into equities.
Together, these three techniques aim to reduce the risk while preserving the expected return, as illustrated in Figure 1.
Volatility Targeting
Figure 2 is a chart reproduced from Harvey et. al. (2018), who wrote about the advantages of risk targeting.
Figure 2a shows that volatility is persistent or ‘clusters’ i.e., high volatility in one month tends to be followed by high volatility in the next month. This observation also underpins Engle’s Nobel-prize winning work on ARCH models.
Figure 2b shows that returns, on average, are not clearly higher following a high volatility month. So the risk-return tradeoff is predictably worse following a highvolatility month. Harvey et. al. (2018) show that this is a feature that holds for risk assets such as equities and credit and link it to the so-called leverage effect.
Figure 2a. Volatility for Quintiles Based on the Previous Month’s Volatility (US Equities, 1926-2017)
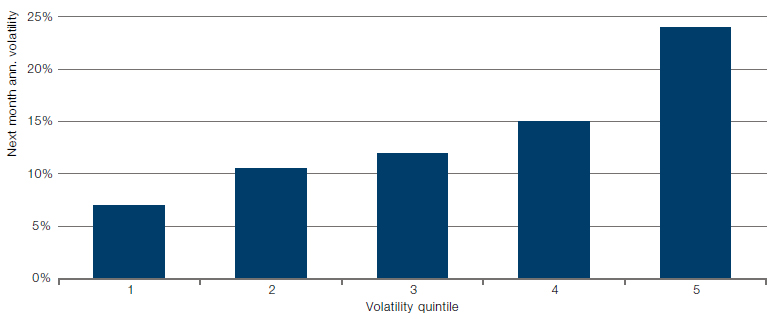
Source: Harvey et al. (2018).
Figure 2b. Return for Quintiles Based on the Previous Month’s Volatility (US Equities, 1926-2017)
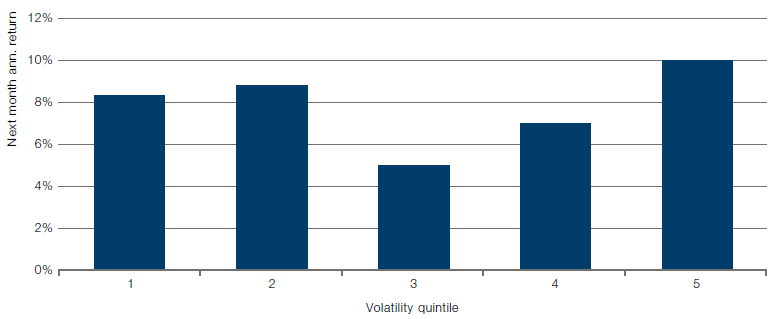
Source: Harvey et al. (2018).
Volatility targeting consistently reduces the likelihood of extreme returns, across all asset classes.
This variation in the risk-return tradeoff can be exploited by scaling up the portfolio at times of low volatility, and scaling down at times of high volatility. Effectively, the portfolio is targeting a constant level of volatility, rather than a constant level of notional exposure.
They authors show that volatility targeting also consistently reduces the likelihood of extreme returns, across all asset classes. This is illustrated in Figure 3, where the rolling 1-year volatility of a volatility-scaled equity position is much more constant than that of an unscaled equity position (both shown to have a 10% full-sample volatility). Particularly relevant for investors, ‘left-tail’ events tend to be less severe, as they typically occur at times of elevated volatility, when a volatility-targeting portfolio has a relatively small notional exposure.
Figure 3. Rolling 1-Year Volatility (US equities, 1926-2017)
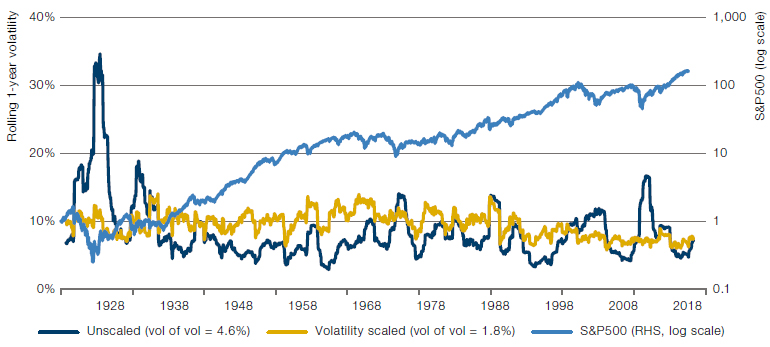
Source: Harvey et al. (2018).
Volatility scaling, as illustrated above, acts to maintain a constant level of portfolio risk. Additional refinements to the technique can be used which cuts risk at times of increased market stress.
Momentum Overlays
Historically, periods of market distress are often characterised by going from bad to worse. Traditional risk metrics often do not account for how prices increasingly follow trends during crises. For example, statistics like standard deviation, skewness, kurtosis, and value-at-risk are expressed for a single period, like a day, week or month.
Hamill, Rattray, and Van Hemert (2016) show how trend-following strategies provide ‘crisis alpha’ during both bond and equity market selloffs since 1960. Harvey et al. (2019) further illustrate how in fact a large portion of trend-following profits are earned during the seven worst equity market sell-offs since 1985. Rattray et al. (2020) argue that rebalancing a 60/40 stock-bond portfolio back to the target mix involves selling winners and buying losers, the opposite of what a trend strategy would do. So during crisis times, regular rebalancing tends to exacerbate drawdowns of the 60/40 portfolio. Adding an allocation to trend, or alternatively ‘strategic rebalancing’ by means of postponing a rebalance trade when equities are underperforming (i.e., ‘don’t fight the trend’) are both shown to be effective measures to reduce drawdowns.
A momentum overlay can help mitigate the negative effects of prolonged negative trends.
A momentum overlay can therefore help mitigate the negative effects of prolonged negative trends. We illustrate the effect of one such overlay in Figure 4, implemented using moving average crossovers on a given instrument in a similar way to a trendfollowing strategy, but in this case only to cut positions by up to 50%.
Figure 4. Aggregated Impact of a Momentum Overlay in Simulation on Stocks (Top) and Bonds (Bottom)
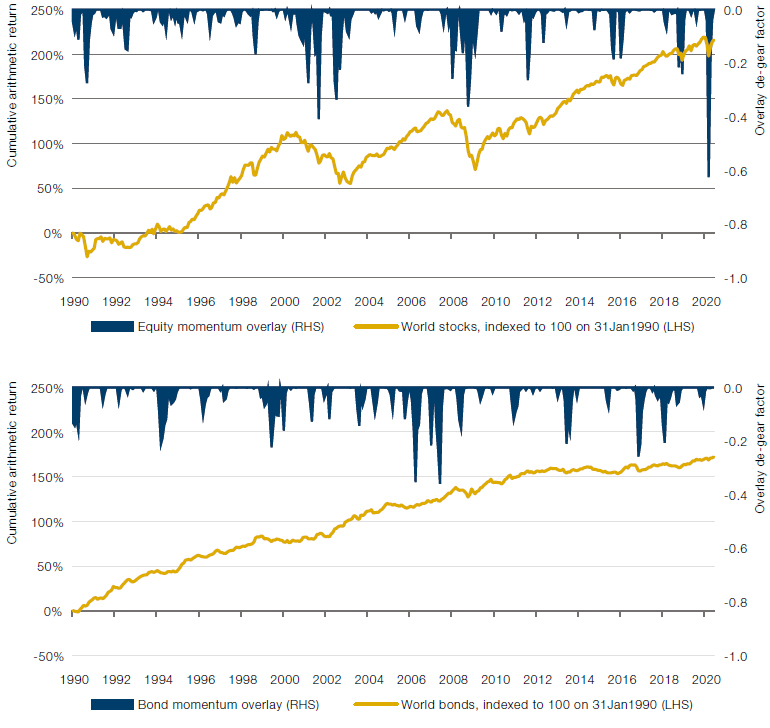
Source: Man Group; as of 10 July 2020.
Note: The position of an individual instrument can be cut by up to 50%. Notice how, for example, the equity momentum overlay acts to reduce positions over crisis periods: Global Financial Crisis in 2008 and Covid-19.
Bond/Equity Correlation Trigger
Like volatility, Harvey et. al. (2018) also show that correlation also tends to be persistent. Funnell (2017) illustrates 250 years of stock/bond correlations, reproduced in Figure 5.
Figure 5. Rolling 10-year Bond-Equity Correlation (UK & US)
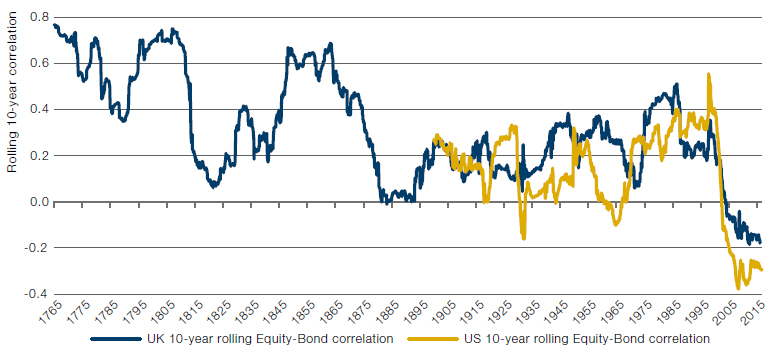
Source: Man Group, Bloomberg, Bank of England; Between January 1765 to June 2016.
Note: Bank of England using monthly returns on UK equities and consolidated bonds.
Particularly worrisome for a long-only multiasset portfolio is a joint stock-bond sell-off, which could for example happen when quantitative easing programmes are suddenly feared to be wound down or inflation surprises on the upside.
Changing portfolio correlation can be addressed through volatility scaling techniqes at the portfolio level. However, Figure 5 shows that negative bond-equity correlation since around 2000 is a rarity from a historical point of view and may very well revert to a more normal positive value. Particularly worrisome for a long-only multi-asset portfolio is a joint stock-bond sell-off, which could for example happen when quantitative easing programmes are suddenly feared to be wound down (e.g. 2013 Taper Tantrum) or inflation surprises on the upside. Both scenarios we deem more likely to hit bond markets first and then spill over into equity markets.
One way to deal with this issue is to use the so-called High-frEquency-bAsed VolatilitY (‘HEAVY’) model, which was put forth by academics at the Oxford-Man Institute of Quantitative Finance (see Shephard and Sheppard (2010) and Noureldin, Shephard, and Sheppard (2012)). This model utilises intraday bond and equity data as a means of forecasting the future correlation between these asset classes and can be used to degear the portfolio when it detects the thread of a bond-driven sell-off.
Conclusion
It is possible to build portfolios using tried-and-tested risk management techniques that have similar risk characteristics to traditional portfolios, but with improved returns. Termed the ‘Z-shift’ because of the figure drawn in risk-return space, the technique makes use of diversification, capital efficiency and risk management overlays.
For the risk management overlays specifically, three categories of risk mitigating techniques can be employed: (1) volatility targeting, which counters persistent fluctuations in volatility by dynamically scaling up the portfolio at times of low volatility, and scaling down at times of high volatility; (2) momentum overlays, which reduces the exposure to assets that are in a downward trend, i.e., ‘don’t fight the bear market’; and (3) a bond / equity correlation trigger, which degears the portfolio when a bond sell-off can potentially spill over into equities.
Bibliography
Dimson, E., Marsh, P., Staunton, “Triumph of the Optimists: 101 Years of Global Investment Returns, Princeton University Press, 2002.
Dimson, E., Marsh, P., Staunton. Credit Suisse Global Investment Returns Yearbook 2019.
Harvey, C. R., E. Hoyle, S. Rattray, M. Sargaison, D. Taylor, and O. Van Hemert (2019), “The Best of Strategies for the Worst of Times: Can Portfolios Be Crisis Proofed”. The Journal of Portfolio Management July 2019, 45 (5) 7-28; DOI: https://doi.org/10.3905/jpm.2019.45.5.007
Funnell, B. (2017), “Fire, then ice”, Man GLG Views
Rattray, S., N. Granger, C. R. Harvey, and O. Van Hemert (2020), “Strategic Rebalancing”, The Journal of Portfolio Management Multi-Asset Special Issue 2020, jpm.2020.1.150; DOI: https://doi.org/10.3905/jpm.2020.1.150.
Hamill, C., S. Rattray, and O. Van Hemert, “Trend Following: Equity and Bond Crisis Alpha” (August 30, 2016). Available at SSRN: https://ssrn.com/abstract=2831926
Harvey, C. R., E. Hoyle, Russell Korgaonkar, S. Rattray, M. Sargaison, and O. Van Hemert (2018), “The impact of volatility targeting”, Journal of Portfolio Management, 45(1), 14-33.
Haydon, K. (2018), “Volatility is back: better to target returns or target risk?”, Man Group working paper.
Noureldin, D., N. Shephard, K. Sheppard (2012), “Multivariate high-frequency-based volatility (HEAVY) models”, Journal of Applied Econometrics, 27(6), 907-933.
Shephard, N., K. Sheppard (2010), “Realising the future: forecasting with highfrequency-based (HEAVY) models”, Journal of Applied Econometrics, 25(2), 197-231.
You are now leaving Man Group’s website
You are leaving Man Group’s website and entering a third-party website that is not controlled, maintained, or monitored by Man Group. Man Group is not responsible for the content or availability of the third-party website. By leaving Man Group’s website, you will be subject to the third-party website’s terms, policies and/or notices, including those related to privacy and security, as applicable.