Key takeaways:
- After an extended period of relative calm, volatility has returned to credit markets. For the time being, spreads offer much better value compared to recent history. We could still see moves wider, particularly with uncertainty high and greater odds of a recession
- Fundamentals remain in decent shape, but could deteriorate further from here. Careful selection on the long side will continue to be key, while the opportunity set for potential shorts is growing
- Increased dispersion is likely to persist throughout 2025 across sectors, countries and capital structures
In focus
After outperforming in late March, credit largely caught up to equity markets and joined the sell-off in earnest in early April. The uncertainty generated by US President Donald Trump’s ‘Liberation Day’ tariffs, along with the rising likelihood of a recession, drove both a notable increase in spread levels and a resurgence in volatility, which had been absent from credit markets for an extended period.
Figure 1. Rising volatility triggers a significant increase in credit volatility
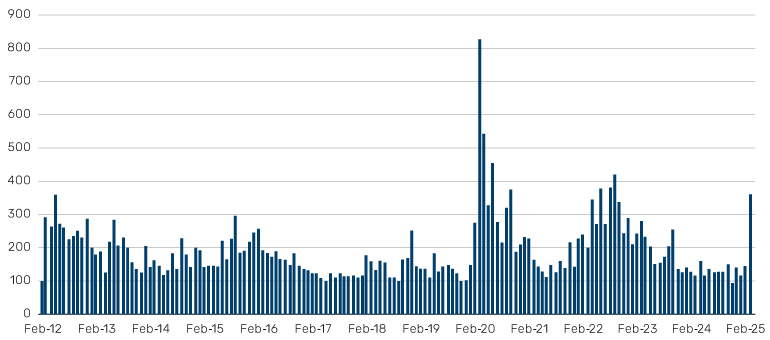
Source: Bloomberg, as of 7 April 2025. Based on CDX / CBOE NA High Yield One-Month Volatility Index.
Credit has a tendency to overshoot both to the up and downside, but after several quarters of emphasising how tight spreads are, recent repricing may present opportunities. With that said, we believe selectivity continues to be key.
Figure 2. Option-adjusted spreads (OAS) in some areas of credit exceed their 10-year median levels
Source: Bloomberg, ICE BofA, S&P UBS. Based on OAS from 7 April 2015 to 10 April 2025. Loans based on discount margin.
Problems loading this infographic? - Please click here
Rising dispersion
The dislocation between Europe and US has been quite telling, with the European market significantly outperforming the US so far. We believe the European market retains several positive drivers and, while it will likely follow the US directionally, we see potential for continued outperformance.
Figure 3: Notable dislocation between Europe and the US
Source: Bloomberg, ICE BofA as of 7 April 2025. Data based on ICE BofA US High Yield Index and ICE BofA Pan European Currency High Yield Index.
Problems loading this infographic? - Please click here
Figure 4. The end of US exceptionalism?
Source: Bloomberg, ICE BofA, as of 7 April, 2025. Data based on ICE BofA High Yield Emerging Markets Corporate Index and ICE BofA US High Yield Index.
Problems loading this infographic? - Please click here
We are seeing similar dislocations within broad sectors and specifically within EM countries, with tariffs potentially creating notable winners and losers.
What are the fundamentals telling us?
Recently, lower quality credit has underperformed higher quality credit, an early sign that greater recession risk is being priced into credit spreads. But is this backed up by the fundamentals?
Turning first to the HY market, leverage ratios – the proportion of a company's debt relative to its earnings – are not particularly worrisome at present, but we expect the pernicious effects of higher interest rates to filter through eventually as companies refinance their debt. Additionally, slowing growth could weigh on earnings, potentially driving leverage ratios higher from here. It may be too soon to assess the impact of tariffs on earnings, but we think it will create greater dispersion within credit markets, leading to the emergence of notable winners and losers. The good news for investors is fundamentals are much more attractive relative to history, particularly if we are approaching the end of the credit cycle.
Figure 5. Leverage ratios are not especially concerning at present…
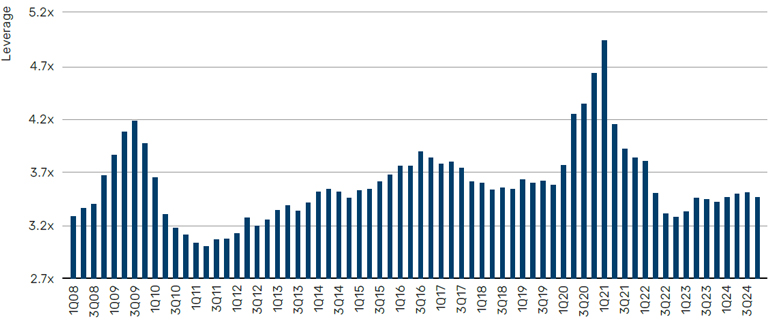
Source: JP Morgan, as of 31 December 2024.
Figure 6. …but leverage levels by industry is showing more signs of dispersion
Source: JP Morgan, as of 31 December 2024.
Problems loading this infographic? - Please click here
What sets this cycle apart, as illustrated in Figure 6, is that traditionally more defensive sectors like telecoms, cable and healthcare are now among those with the highest debt levels and elevated leverage. As they refinance, their interest burden will become increasingly challenging. In light of this, we expect to see more liability management exercises (LME) in the coming quarters, providing a ripe opportunity for stressed and distressed credit trading.
The increase in leverage has been further driven by a growth in equity-monetisation transactions. With the initial public offering (IPO) market relatively barren, private equity (PE) sponsors have reverted to dividend recap transactions – essentially raising debt to pay a special dividend – to help return capital to limited partners (LPs). This has been at the expense of the fundamentals of several portfolio companies. As a result, we are much more cautious about participating in the primary market, though we may re-evaluate these bonds in the future if the opportunity arises to buy at cheaper valuations in the secondary market.
Figure 7. Equity monetisation has increased in both broadly syndicated loans and high yield
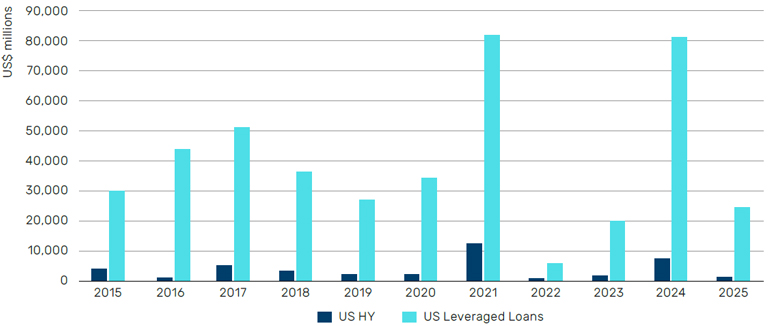
Source: BofA Global Research, Pitchbook/LCD, as of 28 February 2025.
Opportunities in private markets
In private markets, US residential credit and middle-market private credit are, in our view, attractive opportunities for investors to explore.
Within US residential credit, we specifically see opportunities in residential transition loans and lender finance. Lender finance provides term loans or warehouse financing to allow originators to provide whole loans to individuals looking to refurbish houses. We believe structural factors limiting US housing supply will mean more of the existing supply will need to be refurbished to meet the needs of new household formation. Lender finance is backed by highly diversified loans and terms of between one and five years, usually floating rate, with an average loan-to-value after refurbishment of 40-50%, making this an investment-grade-equivalent investment. However, the spreads available are anything but ordinary at 300-400 bps1, in our view, and compare favourably to similar-quality areas of public credit markets, such as collateralised loan obligations (CLOs), investment-grade corporates and other parts of the securitised credit market with floating rates.
Last quarter, we highlighted the significance of size in the direct lending market, and this remains a dominant theme. In the upper middle market, the largest borrowers with more than US$100 million in earnings before interest, taxes, depreciation and amortisation (EBITDA) are continuing to pit private credit lenders against the broadly syndicated loan market, resulting in fierce competition and driving spread compression and the loosening of lending terms. In contrast, greater inefficiencies in lending to smaller borrowers and stronger covenants have translated into outperformance and lower defaults in the core middle market, a topic explored in depth in a recent paper.
In summary, we believe there are opportunities across both public and private credit markets, but investors need to be selective, focusing on fundamentals and the underlying data, rather than buying expensive beta in the current environment.
In brief
In depth
At Man Group, we have no house view. Portfolio managers are free to execute their strategies as they see fit within pre-agreed risk limits. With that in mind, click below to expand the Q2 2025 outlooks from our different credit teams.
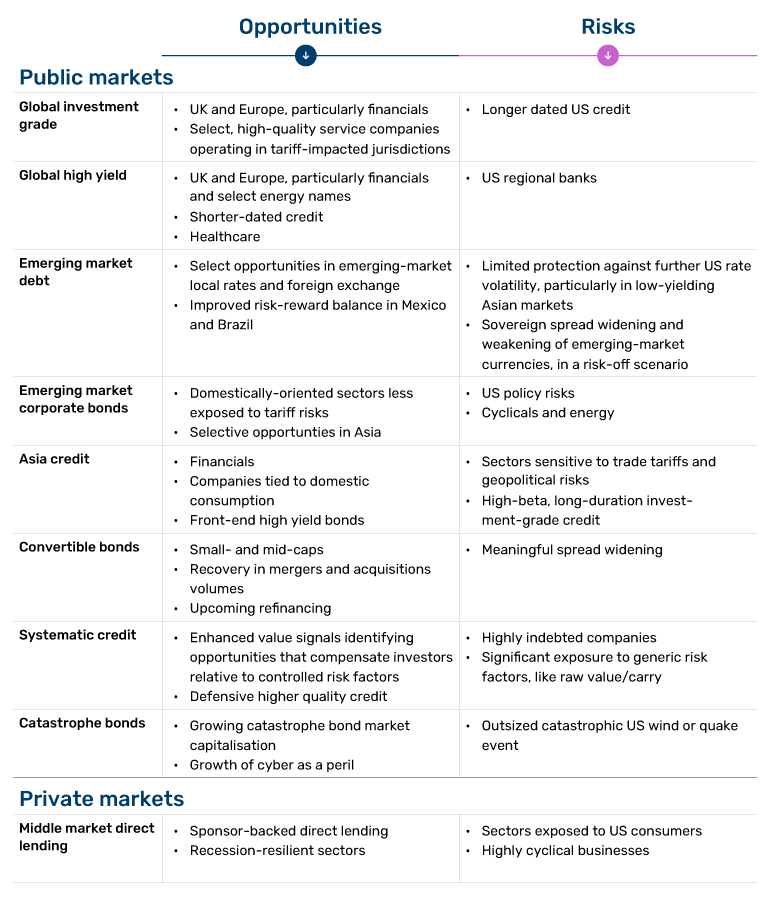
Public markets
The first quarter saw all developed-market (DM) sectors post positive total returns, a function of falling sovereign debt yields. Divergence has characterised investment-grade credit spreads as US spreads modestly widened while Europe continued to tighten. We favour select, high-quality service companies operating in more tariff-impacted jurisdictions where we believe the stability of underlying cashflows will be less impacted than companies operating in the goods sector.
However, ‘Liberation Day’-induced volatility has sparked sharp movements in both yields and spreads as investors begin to unpick what this new regime means for investment-grade markets. Inflation expectations have risen, as has uncertainty.
We continue to focus on lower beta, shorter-dated opportunities. Higher quality asset-backed securities, including Australian residential mortgage-backed bonds, have been a useful defensive play within an uncertain market. We still believe that the best risk-adjusted returns are available in UK and European markets, particularly in the financial sector. However, recent days have presented an opportunity to modestly increase exposure to US senior financials.
Trump’s recent about-turn on tariffs has given the markets a little more breathing space. However, we envisage more volatility in the weeks ahead.
From a total return perspective, high yield delivered a solid first quarter as sovereign yields rallied. However, those gains were quickly reversed as Trump’s announcement spooked investors. Both US and European high yield have suffered as markets have begun to price more pain into what were overly-optimistic credit valuations, particularly in the US.
The sell-off has been stark, with US CCC assets at the forefront of the sell-off. For some time, we have stated that US HY in general has been priced to perfection and a correction was on the cards even prior to ‘Liberation Day’. We have been bearish on the prospects of weaker American credit-card companies and auto-loans providers, where delinquencies have increased materially. We maintain our negative outlook on US regional banks which are highly exposed to a slowing US economy and weakening commercial real estate market.
We believe value in high yield remains skewed towards European financials, as well as energy companies such as FPSOs (floating production storage and offloading), which often maintain long-term contracts with high-quality investment grade firms. We have not materially changed our view on sectors and geographies since 2 April, but continued pressure on North American HY may cause us to close our underweight.
CLO AAA and BB discount margins of approximately 145 basis points (bps) and 785 bps over the Secured Overnight Financing Rate (SOFR) are now around 50 bps and 200 bps wide of their January tights, respectively, with bonds in the secondary now trading at a discount to those offered in the primary, as of 7 April. At 145 bps, AAAs remain 5 bps inside of JP Morgan’s recently revised 150 bps year-end 2025 target for Tier 1 paper. This may be conservative when considering heightened geopolitical uncertainty and increased risk of a slowing economy as a result. While primary activity year-to-date has been strong, we would expect more muted issuance going forward and it is likely that we see increased outflows from CLO ETFs as the prospect of increased volatility and lower rates reduces the attractiveness of these products. While CLO ETFs represent just 3% of the market, they have been a source of incremental demand in a tight market, particularly at the AAA level.
Leveraged loans have declined approximately three points year-to-date, with the leveraged loan index falling below 95, its lowest level since July 2023. Only about 8% of loans are trading at 99.5 or above, compared to 76% at the end of 2024. For the week ending 4 April, the loan index dropped approximately 1.74 points, marking the largest weekly pullback since March 2020. The selloff varied significantly across credit quality and tariff exposure:
- BB-rated loans and defensive businesses not exposed to tariffs were down approximately 0.75 points
- Single B-rated loans without tariff exposure fell 1.5-2 points
- Mid/low single B cyclicals without direct tariff risk declined 2-4 points
- Loans with tariff exposure dropped 3-6 points
From a sector perspective, telecom, metals/mining and utilities have outperformed year-to-date, while chemicals, retail and consumer products have lagged.
Looking ahead, policy uncertainty and tariff-driven growth headwinds have raised market expectations for rate cuts, despite concerns about near-term inflationary pressures. This is likely to drive continued ETF and retail outflows, adding technical pressure to the market. CLOs remain better buyers of higher-quality loans, but rising recessionary risk and an increase in downgrades could lead to further decompression in lower-rated risk. The market has shifted towards a credit-pickers environment, barring a sudden change in policy.
Multi-decade highs in uncertainty, driven by the new US administration’s trade and policy stance, ongoing geopolitical tensions and the potential for US fiscal policy to turn contractionary, are weighing on the outlook for emerging market (EM) growth and inflation. This has impacted recent EM central bank decisions, creating challenges for local rates as disinflation stalls and economic activity slows. The dovish bias seen a year ago has faded, leading to less synchronised policy adjustments, with central banks in Latin America and Europe, the Middle East and Africa (EMEA) turning more hawkish, while those in Asia have become more dovish. These diverging policy dynamics are likely to persist and are already impacting local yields. While attractive real rates and a year-to-date increase in risk premiums provide some support in specific markets, the overall risk premium to core rates, at 233 bps, remains near the lower end of its historical range. This offers limited protection against further US rate volatility, particularly in low-yielding Asian markets, where negative spreads to US Treasury (UST) yields constrain compression potential and insufficient carry fails to adequately compensate for capital control risks. We are more constructive on countries such as Mexico, where slow growth, strong disinflation momentum, and currency resilience have allowed a dovish pivot, and Brazil, where an ongoing hiking cycle has improved the risk-reward balance despite underlying macro vulnerabilities.
EM currencies experienced some near-term relief in the first quarter due to the delay in US tariff implementation, while the weighted current account balance of countries in the GBI-EM Global Diversified (GD) Index has returned to equilibrium. Valuations remain attractive on a real effective-exchange-rate basis for select higher yielding currencies. However, caution is warranted in the months ahead, as EM currencies tend to weaken during periods of US economic slowdown, which negatively affects overall risk appetite.
On EM sovereign credit spreads, we prefer a more defensive approach, emphasising alpha generation and selective country exposure over broad beta risks. In our view, EM spreads continue to exhibit an asymmetric risk profile, with limited scope for further tightening but elevated risks of a sharper widening, particularly if a stagflationary scenario materialises in the US.
EM demonstrated resilience in the first quarter, which is less surprising than one may initially assume. The fundamentals of the EM corporates universe were strong at the start of the year, with lower leverage, higher credit quality, improved local issuance and demand, coupled with the fact that maturity walls have largely been dealt with in primary markets.
Post ‘Liberation Day’, we have observed sharp widening across the market with EM corporate HY spreads now close to 500 bps, a level not surpassed since March 2024. We believe that this volatility will conjure up opportunities across Latin America and more domestic-oriented firms operating in China and Hong Kong. However, we remain cautious of consumer-focused sectors most exposed to a slowdown, as well as technology and communications.
Beyond tariffs, we must comment on tensions in Eastern Europe. Recent developments for a limited ceasefire in Ukraine, covering only energy and infrastructure remains a work in progress. Remaining nimble in Ukraine and wider Eastern Europe and cautiously underwriting the risks of a sharp reversal in any de-escalation will be vital for active managers. Political instability in Turkey and Romania over the start of this year have also provided a good example of how dislocations between corporate fundamentals and market sentiment can emerge in this space. In EM credit investing, it is key to monitor these risks and no matter how solid fundamentals appear, to build in the right protections to take advantage of the opportunities that are abundant across EM regions, while isolating portfolios from tail scenarios that are also presently more common or probable than DM regions.
Asia credit continued to deliver strong performance during the first two months of 2025, supported by robust fundamental credit momentum despite escalating uncertainty surrounding trade tariffs and geopolitical risks. Asia credit spreads remained stable, even with the 20% increase in US tariffs on China in the first quarter. To mitigate the potential negative impact from tariffs, Chinese policymakers continue to roll out stabilisation measures to support domestic consumption or to recapitalise banks. Within Asia, export-oriented economies, such as Vietnam, Sri Lanka and Korea, will likely be most impacted given their exposure to the steel and automobile industries or their high dependency on exports to the US.
As we highlighted in our last outlook, the market had already priced in a greater tariff impact on Asia credit relative to its peers. Additionally, Asian issuers have demonstrated resilience, supported by their strong credit metrics.
Notably, Asia was the only region to record zero corporate defaults in the first two months of 2025, according to Moody’s. This highlights the region’s credit strength amid a challenging macroeconomic environment.
Fund flows into Asia credit funds turned positive during this period, reflecting growing investor confidence. Despite tighter spreads relative to US credits, the combination of high absolute yields and a favourable bond demand-supply dynamic continues to attract investors looking to increase their exposure.
Looking ahead, we remain cautious on sectors sensitive to trade tariffs and geopolitical risks, instead preferring exposure to companies tied to domestic consumption. We maintain a positive outlook on financials, supported by strong government backing and countercyclical measures. Our strategy favours overweighting front-end high yield bonds, which offer attractive carry, strong fundamentals and a low default rate. Conversely, we remain underweight on high-beta, long-duration investment grade credits due to their vulnerability to market volatility.
Despite the growing risk of a trade war, macro uncertainty and a US sell-off led by tech and crypto names, convertible bonds (CBs) delivered positive performance in the first quarter and the Global CB Index closed up 2%, ahead of global stocks, corporate bonds and government debt. Amid artificial intelligence (AI) optimism, performance was driven by Asia tech firms which replaced US mega-cap names as market leaders. European CBs also performed relatively well as European equities outpaced other regions.
In the primary market, 2025 got off to a sluggish start amid geopolitical and macro uncertainty, though the pace improved in February and March and first quarter volumes reached US$22.8 billion – largely driven by refinancing activities. With around US$5 billion raised across dollar-denominated and local markets in Asia. Asia was active on a regional basis, and we also witnessed a wave of bank-led exchangeable deals.
Elevated volatility and historically tight credit spreads have pushed up valuations but, despite recent outperformance, Asia still screens as the cheapest region globally.
On the near-term outlook for convertible bonds as an asset class, we expect performance to be influenced by an ongoing broadening of equity markets beyond large-cap stocks, given small and mid-cap stocks (SMID) make up a large portion of the convertible bond universe. The relative valuation between SMID-cap and large-cap stocks is still at its historical low and we expect this to spur outperformance for the former as we move through the rest of the year. On top, the inherent convexity of the asset class is an attractive feature in a market characterised by geopolitical and macro uncertainty.
Although it is yet to make a significant impact, the 2024 pick-up in mergers and acquisitions (M&A) is expected to continue this year given more favourable policies from Washington, attractive valuations and healthy credit market conditions. This will be a tailwind for convertibles, both from a primary and secondary market perspective, as the large valuation gap means SMID-cap equities are attractive targets for cash rich acquirers.
Primary activity is expected to be solid this year, with almost 30% of the market needing to be refinanced before the end of 2026, providing fertile ground for opportunities. On top, primary volumes are likely to remain supported by the still-elevated rates environment while a broader recovery in Chinese equities and AI optimism may lead Chinese companies to continue issuing dollar-denominated CBs.
After being in net outflow territory since 2021, long-term CB mutual funds trend turned positive last month, and we expect this trend to continue.
In an environment characterised by heightened uncertainty, geographic and sectoral risk management is as critical as ever. Moreover, in the face of elevated economic uncertainty, the focus should be primarily on security selection informed by company fundamentals rather than having a substantial percentage of one’s risk budget being driven by top-down tilts, including active country and sector weights, or duration and other macro risk exposures.
With all that said, increased uncertainty can lead to both market and cross-sectional volatility, which can in turn create opportunities to capitalise on mispricing through active trading. This requires an agile trading strategy and sufficiently low transaction costs to generate alpha net of expenses. In our view, managers who are well-positioned to take advantage of the ongoing evolution in credit trading toward electronic execution should reap these benefits.
Our models are highlighting opportunities in defensive, high-quality credit, as well as in value-driven signals that compensate investors for controlled risk exposures. However, notable risks remain, including vulnerabilities tied to highly indebted companies and over-reliance on generic risk factors, such as raw value or carry strategies.
As we stated last quarter, systematic processes are increasingly being applied to segments of the fixed income market beyond traditional high-yield and investment-grade bonds. This ongoing shift continues to present new opportunities for systematic approaches.
Figure 8: Option-adjusted spread dispersion by sector
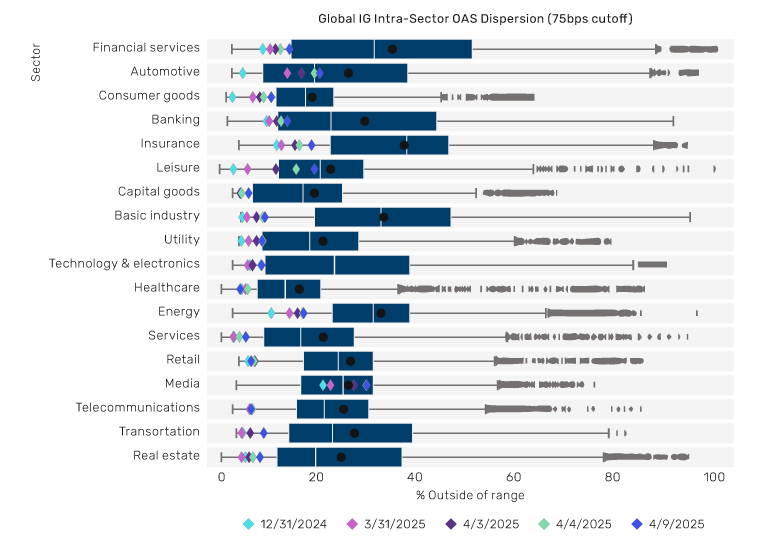
Source: Man Numeric, as at 9 April 2025.
Record-breaking issuance in the first quarter of over US$6.5 billion propelled the market capitalisation of catastrophe (cat) bonds to just under US$50 billion. New issues were well bid for, on average, deals being upsized by about 49% from launch. Sponsors included the usual insurers, reinsurers and healthcare companies, but we were pleased to see Flood Re enter the market for UK Flood cover, Pool Re return for a renewal of UK terrorism cover, and Hannover Re renew (and upsize) its cloud outage cover.
Los Angeles wildfires dominated bond valuations, with exposed bonds being marked down by a total of about US$730 million by mid-February, later recovering to a more modest US$430 million by the end of March. While the market is undoubtedly cautious about wildfire bonds, a deal was successfully launched for Sutton linked to wildfire and fire following earthquake. The SwissRe cat bond index is up about 0.84% for the year.
It is still early for forecasts in respect of the Atlantic Hurricane season, but a couple of forecasters suggest near normal activity, with above average sea surface temperatures being offset by slightly weaker than average Caribbean trade winds. However, these early forecasts come with large forecast error, and what matters to insurers is the exact path of a storm: even in a quiet season, a single storm can produce catastrophic losses (e.g. Andrew, 1992). Bond maturities and capital inflows have meant that insurance rates softened around the turn of the year, but with the supply of ample new deals, supply and demand is now more balanced. We expect the market cap to exceed US$50 billion this year, and for cyber to modestly increase its weighting in the space. With new sponsors, investors and perils, we expect continued penetration of cat bonds into fixed income and credit portfolios.
Figure 9. Market capitalisation of cat bonds propelled to just under US$50 billion
Source: Man Group database, as of March 2025. Aqua blue bar shows data through to end of March 2025. Dark blue bars show year-end data.
Problems loading this infographic? - Please click here
Private markets
Sentiment on tariff and corresponding concerns over US growth prospects dominated public markets in the first quarter, prompting a rotation away from US equity markets toward European opportunities. Should inflation persist, interest rate reductions may slow, potentially leading to higher default and loss rates in the second quarter.
In response to increased macroeconomic volatility, investors have turned to the private credit market for diversification, lower volatility and consistent income. In private credit markets, the upper middle market is seeing dramatic spread compression, with deals coming in at spreads of 500 bps and below due to intense competition. In the middle market, spreads remain at SOFR +500 bps, plus 1.25-1.75 points of original issue discount (OID). While middle-market direct lending maintains a relative yield advantage versus the upper middle market, we continue to believe a selective and conservative view of credit selection and underwriting is prudent.
Assets with stable cashflows, strong sponsor backing and robust covenant structures are positioned to outperform, in our view, particularly in non-cyclical and inflation-resistant sectors. We anticipate a divergence in manager performance in the second quarter as the impact of tariffs begins to materialise.
With regard to volumes, the market is currently ahead of the record 2024 issuance run rate, with the January calm firmly in the rear-view mirror. The US is slightly slower than anticipated due to political uncertainty, but consistent with our approach, our focus is on Europe where there are currently more efficient transactions on offer.
Credit spreads widened consistently during the last month of the first quarter, with US high yield spreads (CDX HY) adding approximately 70 bps to end the month at 376 bps. We expect spreads in the credit risk sharing (CRS) market to follow suit, but as is typical, lagging traditional liquid credit. In the meantime, we have taken a conservative stance to underwriting new transactions, awaiting the emergence of tighter standards and higher pricing. We are cautious about the effects of stubborn inflation and tariffs on the liquidity needs of businesses in the medium term, and their potential to draw on sources all the way to the top of the capital structure – where CRS exposures usually sit. As such, we have added sufficient risk weights on those sectors worst hit by policy volatility and with the potential to be hit by a weakening consumer.
If we consider that spreads are simply a function of default probability over time, high spreads discount high defaults and vice versa. Spreads are widening due to expectations for slower growth and higher defaults. If you subscribe to that (efficient market) theory, then the level of spread does not matter too much. However, we see uncertainty as an opportunity to remain selective, trading short-dated transactions to lock in premiums that we believe are accurately underwritten.
We continue to view the US housing market as healthy and benefiting from structural protections to insulate investors during times of macroeconomic uncertainty. We expect to see this current market dynamic persist, with compelling opportunities for investors seeking income-driven returns from low-volatility, diversified credits backed by liquid residential collateral.
At a high level, the US housing market continues to deal with limited supply and a higher interest rate backdrop which we think will keep valuations trending higher. Other factors that could drive prices higher include the large spread between mortgage rates and the 10-year UST, which is coming in at around 240 bps compared to the 150 bps historical average. If we see a compression in this rate driven by lower federal fund rates, this should be supportive of the housing market. On the supply side, tariffs should increase building costs which will only further constrain the limited supply coming into the market.
Within US residential credit, we specifically see opportunities in residential transition loans and lender finance. Lender finance provides term loans or warehouse financing to allow originators to provide whole loans to individuals looking to refurbish houses. We believe structural factors limiting US housing supply will mean more of the existing supply will need to be refurbished to meet the needs of new household formation. Lender finance are backed by highly diversified loans and terms of between one and five years, usually floating rate, with an average loan-to-value after refurbishment of 40-50%, making this an investment-grade-equivalent investment. However, the spreads available are anything but ordinary at 300-400 bps1, in our view, and compare favourably to similar-quality areas of public credit markets, such as CLOs, investment-grade corporates and other parts of the securitised credit market with floating rates.
1. Source: Man Group.
You are now leaving Man Group’s website
You are leaving Man Group’s website and entering a third-party website that is not controlled, maintained, or monitored by Man Group. Man Group is not responsible for the content or availability of the third-party website. By leaving Man Group’s website, you will be subject to the third-party website’s terms, policies and/or notices, including those related to privacy and security, as applicable.