Executive summary
There can be little doubt that investors were scarred by bonds’ performance in 2022. No more so than in a multi-asset context, where risk assets also performed poorly. That wasn’t in the script. But yield levels have reset, and with inflation and inflation risk moderating, the future, we believe, is considerably brighter.
We find that bond valuations are more attractive than they have been in a decade. Receding inflation risk also means that bonds will once again provide diversification benefits for investors.
Higher bond yields should not lull us into a false sense of security, however. Bond allocations should not be implemented naïvely. 2022 was a stark reminder that active risk management is crucial in dealing with the unexpected. We don’t expect that to change in the future.
Bonds: The comeback kid
The theme’s bonds, government bonds. For decades, bonds were a friend to equity investors. But not in 2022 when the inflationary environment drove down stock and bond markets simultaneously. Bonds are not always a low-risk crutch to the stock market and present risks in their own right. This was not news to financial historians and those investors with long memories, but following the events of 2022, it is now widely understood. Bonds also provide rewards, in the form of both returns – especially when yields are higher – and diversification.
The bond market, often regarded as a prosaic area of finance, has played a crucial role in human society over centuries.
After more than 18 months of rate hiking, we have moved along the economic cycle. Although it is too early to call victory, inflation – and inflation risk – are undoubtedly being tamed. Will bonds play nicely from here? Let’s consider some of the evidence.
The bond market, often regarded as a prosaic area of finance, has played a crucial role in human society over centuries. It has funded everything from railways to wars to modern-day technological innovations. But there have been challenges along the way: the high inflation which characterised the 1970s and the European debt crises, to name just two. Shifting interest rates, financial innovation and regulatory liberalism drove several changes in the 1980s, which shaped the bond market structure as we know it today.
2022 proved to be the latest inflection point in the bond market’s history characterised by a surge in inflation due to post-pandemic demand, constrained supply chains, a tight labour market, a war in Europe and an energy crisis. Central banks worldwide tightened financial conditions, leading to all-time-high bond losses and elevating the MOVE Index – a measure of bond volatility – to its highest level in a decade. Although inflationary pressures have eased, at least temporarily, the repercussions of the bond sell-off still resonate in 2023, affecting the bond market’s structure and performance. The MOVE Index remains at elevated levels compared to the last decade. However, equity volatility, as measured by the VIX and V2X indices, are below their long-term averages, as shown in Figure 1.
Figure 1. Bond volatility, MOVE, at its highest level in a decade. Equity volatility, VIX and V2X, lower than average. RHS chart shows the current level of volatility relative to history
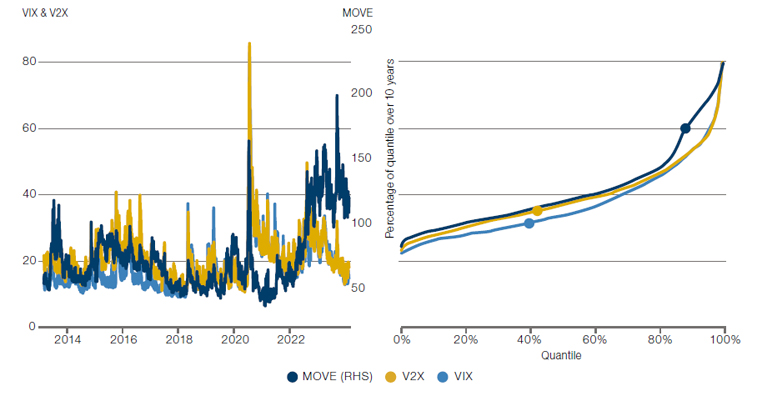
Problems loading this infographic? - Please click here
Source: Bloomberg, as of July 2023. RHS chart measures the quantile and percentage of quantile of equities and bonds implied volatility indices for Jan 2013 to July 2023.
After a challenging period for bonds, macroeconomic conditions may be turning in their favour:
1. Inflation is moderating
Inflation is displaying clear indications of further moderation (Figure 2). The inflation heatwave that prompted the Federal Reserve’s (Fed) aggressive rate hiking has cooled, and disinflation is now conspicuous in many CPI components. Eased supply chains have helped drop core goods prices and falling gas prices are bringing down energy inflation.
Figure 2. US, EU and UK year-on-year headline inflation Consumer Price Index is moderating
Problems loading this infographic? - Please click here
Source: U.S. Bureau of Labor Statistics. UK ONS. Europe: Eurostat. Data range: July 2003-July 2023.
2. Inflation risk is falling
Asset prices are impacted not only by inflation rates and changes in rates, but also inflation risk. Higher inflation risk demands higher term premia, and hence higher bond yields. We are now seeing inflation risk receding (Figure 3), which could place downward pressure on yields.
Falling inflation risk is good for bond returns and good for diversification.
Inflation risk, at least relative to growth risk, also has implications for cross-asset correlations. Positive (respectively negative) inflation surprises are bad (respectively good) news for both stock and bond markets. However, growth surprises are more likely to drive stock and bond prices in opposite directions, e.g. with positive surprises being good news for stocks but bad news for bonds. So, the stock-bond correlation is sensitive to the relative extent of inflation risk and growth risk. Over much of the last 30 years, inflation has remained low and stable meaning growth risk was greater than inflation risk and the stock-bond correlation was persistently negative. This provided diversification benefits to multi-asset investors. The rise in inflation risk which accompanied 2021’s post-pandemic reopening, however, culminated in the joint stockbond sell-off of 2022.
In short, falling inflation risk is good for bond returns and good for diversification.
Figure 3. Annualised volatility of US inflation is decreasing
Problems loading this infographic? - Please click here
Source: US Bureau of Labor Statistics. Data range: Jan 1970-July 2023. 36-month rolling standard deviation of monthly, seasonally adjusted, CPI rate.
Gaining the potential to generate returns in a broad range of economic outcomes is the principal motivation behind much of multi-asset portfolio construction.
3. Growth risk is moving back to centre stage
As we have discussed, inflation and inflation risk are falling as central banks tighten monetary conditions. The open question is what happens to growth? The increased cost of borrowing will have a negative impact, but the US jobs market continues to look strong, with unemployment at 3.8% at the time of writing. The US economy could yet experience a hard landing, a soft landing or the metaphorical martlet, a “mythical” no landing. A resilient economy is potentially bad for the bond market, but good for risk assets. Generating returns in a broad range of economic outcomes is the principal motivation behind constructing balanced portfolios consisting of bonds as well as risk assets.
The role of bonds in a multi-asset portfolio
Why hold bonds in the current environment as part of a balanced portfolio?
1. Yields are higher
In the zero (or even negative) interest rate world that followed the Global Financial Crisis (GFC), the risk to holding bonds became asymmetric; the amount that yields could realistically rise became much greater than the amount they could realistically fall. The situation was similar for the Fed funds rate. The history of the Fed funds rate (as shown in Figure 4) tells the story, and its inevitable conclusion, well. Since the start of the Great Moderation in the mid-1980s, the Fed funds rate traced a pattern of gradual increases and sharp declines (up the escalator and down the elevator). Starting from zero, and with inflationary gusts providing a fearful tailwind, the dynamics of Fed funds rate changed dramatically in 2022. This time the rate hiked its way up in the elevator, dragging bond yields up with it.
But now the Fed funds rate is higher and yields are higher. From this starting point, investors are offered a higher yield to hold bonds, while the risk of yields moving higher or lower is more symmetrical. We expect to see smaller and less frequent moves in the Fed funds rate from here, which should also mean a decline in bond price volatility.
Figure 4. Fed Funds Effective Rate - Up the escalator and down the elevator?
Problems loading this infographic? - Please click here
Source: Fred. Percent, monthly, not seasonally adjusted. Date range: July 1984-July 2023.
Nominally, the opportunity cost of owning bonds versus stocks is at its lowest level for over two decades. Including some risk adjustment, the argument becomes more compelling.
2. Relative valuations are more attractive
Last year, heightened volatility across capital markets reset valuations. Now the dust is settling, yields are at their highest levels in two decades.
We can also compare bond yields to earnings yields (Figure 5). This comparison is sometimes used as a relative valuation model for asset class selection (the so-called Fed model).1 Expensive assets can remain expensive for longer than many value investors can remain solvent, so we are not presenting the chart in exactly this light. Instead, we wish to make the point that nominally, the opportunity cost of owning bonds versus stocks is at its lowest level for over two decades. Including some risk adjustment, the argument becomes more compelling. Our case, then, is for a balanced portfolio.
Figure 5. The US 10-year yield is catching up with forward earnings
Problems loading this infographic? - Please click here
Source: Man Group database and Bloomberg. Date range: Aug 1993-Aug 2023.
3. Help balance risk
Robertson (2020) contrasts the 60/40 portfolio (consisting of 60% equities and 40% bonds) with a risk-balanced portfolio. His research showed that despite the apparent diversification of the 60/40 portfolio, it has a correlation of 93% to equities, but a low correlation to bond returns. On the other hand, the risk-balanced portfolio allocates across asset classes based on risk rather than capital. This approach significantly reduces the correlation to equities to 48%, with the enhanced diversification resulting in lower drawdowns and higher average returns.
Figure 6. Valuation and forward return for risk balanced portfolios2 are more attractive than those for equity/ bond 60/40
Mitigating tail risk
Execution is key
Quo vadis?
While diversification and the safe haven nature of bonds can be effective under certain market conditions, we should not solely rely on these.
Yet, this analysis is backwards looking. What if the next 20 years look different from the past 20 years? Will a risk-balanced portfolio keep pace with the 60/40? We believe so. Given today’s relative valuations between equities and bonds, the risk-balanced portfolio’s greater allocation to bonds compared to the traditional 60/40 portfolio is advantageous.
Inspired by Neville and Robertson (2023), in Figure 6 we map forward returns to valuations for the 60/40 portfolio and the risk-balanced combination of equities and bonds. A similar pattern is discernible for both portfolios; as valuations become richer, forward returns are lower, and the relationship is convex. For both, current valuations are higher than average over history. For 60/40, the current valuation is consistent with a 5.5% nominal compound annual growth rate (CAGR) over the next decade, with a historical range of 2-10%. For the risk-balanced portfolio, this rises to 8.8%, with a historical range of 6-12%. This greater level of certainty, we believe, is helpful to allocators.
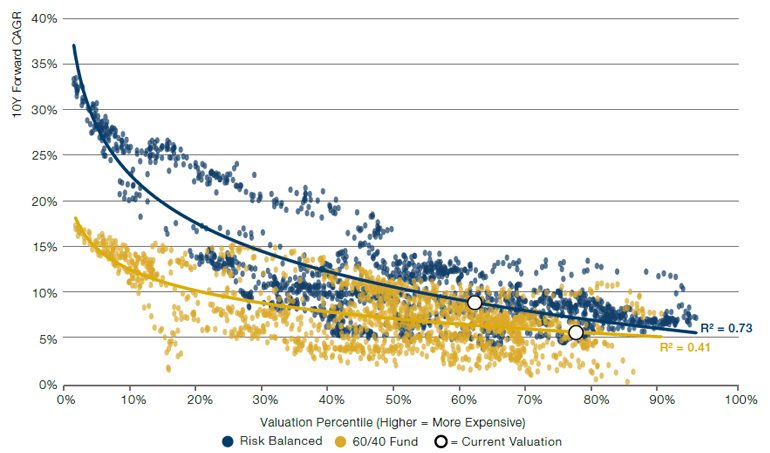
Source: Man Group database and Bloomberg. Date rage: Aug 1996-Feb 2023.
While diversification and the safe haven nature of bonds can be effective under certain market conditions, we can do better. Inevitably, there are tail risks to consider. Inflation could return. We could experience another 2022. The jobs market is still tight. Wages may be bid up leading to the dreaded wage-price upward spiral. Geopolitical risks also remain: Russia and energy. China and trade restrictions. Instead of trying to predict future market movements — an inherently uncertain endeavour — active risk management becomes critical in curbing potential losses (Robertson, 2022). It requires discipline and careful cost management, but it can be effective.
To mitigate risk in multi-asset portfolios, we could use economic modelling. However, we find it more pragmatic and effective to use direct, data-driven methods, informed by systematic risk management principles. Some such approaches include:
- Monitor the bond-equity correlation, identifying signs of breakdown in cross-asset diversification, which would signal a need to reduce exposure.
- Respond to changes in market volatility by sizing positions in accordance with risk, and further reducing exposure during volatility spikes.
- Use high-frequency data to enhance the power of statistical analyses and enable more prompt reactions to market changes.
- Pay close attention to price trends. Persistently falling prices of an asset may indicate the market slowly adjusting to a deteriorating outlook for that asset, perhaps reflecting a growing belief in a regime shift. In the face of such downward price trends, it would be prudent to reduce exposure to those assets
Combining even this short list provides a comprehensive, flexible, and data-driven risk management framework for navigating complex and uncertain market conditions. Note that the risk management approach requires only price data, which are timely and often of high quality, particularly in comparison to economic data, which arrive infrequently, with lags and are subject to revision.
There is a cost associated with active risk management, however. As market conditions change, assets may be bought and sold more frequently, leading to increased transaction costs, including brokerage fees and crossing bid-ask spreads. Costs impact performance, so while active risk management is essential in mitigating potential losses, the associated increase in transaction costs and market impact should be carefully controlled (Korgaonkar and Robertson, 2021a, 2021b).
Cost management requires resourcing. Some costs are known with certainty before trading (e.g. commissions), some are known with certainty only after trading (e.g. the difference between arrival price and execution price) and some are never known with certainty (e.g. market impact).
Controlling all three cost types is challenging and some key considerations include:
We think a blend of diversification and active, systematic risk management is the best strategy to address this uncertainty.
- Determining the desired level of aggressiveness in implementing active risk management, taking into account the potential for increased slippage.
- Deciding on the frequency and method for monitoring the market for price updates across multiple assets.
- Planning how a large trade should be divided into sub-orders, incorporating the unique liquidity and volatility of the asset.
We are firm believers that balanced, multi-asset portfolios coupled with active risk management are a robust way of navigating uncertain financial waters. We don’t pretend to know what the future holds. What we do know, however, is that bond valuations are more attractive than they have been for some time, and multi-asset portfolios are well placed to take advantage of this.
Bibliography
Robertson, G., “We See Risk Where Others May Not: 60/40 in 2020 Vision”, November 2020.
Korgaonkar, R, Robertson, G., “We See Risk Where Others May Not: Active Risk Management in Practice”, September 2021a
Korgaonkar, R, Robertson, G., “We See Risk Where Others May Not: The Z-Shift Framework - Empirical Evaluation Since 1995”, September 2021b.
Robertson, G., “No More Horses! The Predictability of Returns and Risk, and Their Use in Asset Management”, May 2022.
Neville, H, Robertson, G. “The Road Ahead: Of Rocks and Hard Places”, July 2023.
1. The Fed model is a useful heuristic. However, like all models, it is based on assumptions. These assumptions (all earnings are paid as dividends, dividends do not grow and the equity risk premium is nil) are strong and usually violated, and so a direct comparison of the earnings yield to the bond yield is not a fair one.
2. In yellow is a 60/40 equity/bond portfolio with static percentage allocations, rebalanced monthly. In blue is a risk-balanced combination of the same. The weight of each element is determined monthly, based on scaling to 10% volatility on a 3-year lookback. For each, we show the relationship between the valuation (based on Shiller PE and the US 10-year Treasury yield. See Neville and Robertson (2023) for details) and the subsequent 10-year CAGR that each portfolio generates.
You are now leaving Man Group’s website
You are leaving Man Group’s website and entering a third-party website that is not controlled, maintained, or monitored by Man Group. Man Group is not responsible for the content or availability of the third-party website. By leaving Man Group’s website, you will be subject to the third-party website’s terms, policies and/or notices, including those related to privacy and security, as applicable.