Key takeaways:
- The simultaneous stretch in earnings and valuations, coupled with deteriorating economic indicators, suggests significant risks of a market correction
- Hidden weaknesses in labour and consumer sectors, along with stagnant productivity despite the hype about artificial intelligence (AI), indicate that the economy is not as robust as it appears
- External economic fragility, unexpected costs of FX hedging, and geopolitical tensions add to the uncertainty, making us doubt the prospect of a "soft landing"
The true princess, as Hans Christian Andersen’s tale goes, will be kept awake by a single uncooked pea, even if it’s covered with 20 mattresses and feather beds. Here are 10 things keeping me up (pick me, Prince Charming).
1. There’s a dual stretch in earnings growth and equity valuations
A cat always lands on its feet, so they say. Still, this mog’s been thrown a long way up. Over the long term, real earnings mean revert around the log trend. However, per Figure 1, today they are a long way above. They’ve also been there for a record amount of time: since 2010, to be precise. And, as the chart shows, this has happened at a time when valuations are simultaneously stretched. We’re deep into the top-right quadrant, which is not a comfortable place to be.
For the S&P, the market currently expects 12% growth in earnings-per-share (EPS) over the next 12 months. It is putting a 21x multiple on those earnings. Over the last cycle (2010-2019), the average multiple was 15x and earnings growth was 11%. Imagine that we revert to the average growth level, and shave three points off the multiple (so still well above the last cycle average, as well as the trough in 2022 [which also happened to be 15x]), that would equate to a 14% drawdown. “What’s the catalyst?” the cry goes up. Nothing. With this dual stretch you can get that for free. If we see a ‘genuine’ event, the downside will be much greater.
Figure 1. S&P Shiller CAPE vs deviation from log Trend earnings (monthly data, 1881-2024)
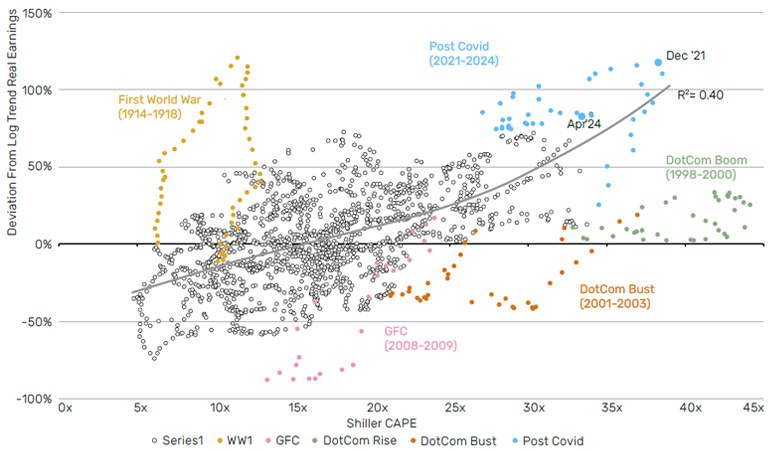
Source: Shiller data. Chart inspired by Gerard Minack. Trend line is 3rd order polynominal fitted on months excluding WW1, GFC, DotCom Boom and Bust.
2. The ISM has been at or below 50 for 18 consecutive months
The lines in Figure 2 denote the number of consecutive months where the Institute of Supply Management’s (ISM) Purchasing Manager’s Index (PMI) was in contractionary territory, in other words below 50. I say 18, but that’s not strictly true. It poked a toe over in March (50.3) but, between friends, let’s just call it a long time. Referring again to Figure 2: where we’ve reached these heights previously, we’ve either been in a recession, or had one about to begin. Monday’s print was also in contraction, with a New Orders component at 45, 4 points below expectation. And it’s not just the ISM. The Federal Reserve’s Senior Loan Officer Opinion Survey (SLOOS) data, another bellwether of macro activity, is at a level that would suggest 0% growth based on its historic link with GDP.1
Figure 2. There is a strong link between the ISM sinking below 50 and recessions
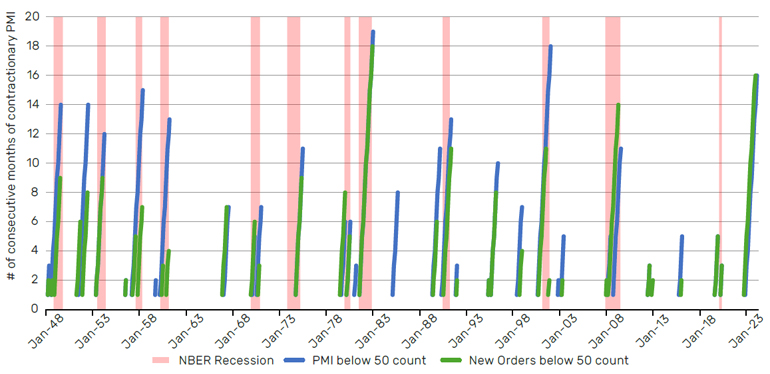
Source: Bloomberg.
3. The US labour market is weaker than everyone says
The unemployment rate, like Pompeii, will be fine until it isn’t. And, in the meantime, a number of leading labour indicators are running at various shades of mediocre to poor. The official Job Openings and Labor Turnover Survey (JOLTS) Hiring Rate has been declining since late 2021 and is now back to 2013 levels. Companies stop hiring before they start firing. The Bureau of Labor Statistics Temporary Help Services is moving down and is now back at 2014 levels. Temporary employees get fired before permanent ones. The Department of Labor’s Initial Claims data looks great, flat since mid-2022 at the historically low level of 215,000 people. But the Continuing Claims report has risen by 437,000 over the same time. So it might be that few people are getting laid off presently, but it seems that some of those who are losing their jobs are struggling to re-enter employment. Something’s afoot.
And then there’s the Sahm Rule, which stipulates that where the three-month moving average (3MMA) of the US unemployment rate increases by 50 basis points (bps) above the trailing 12 month minimum, you’ve almost always been in a recession. Today we’re at an increase of 37bps. The market peaks between three to six months prior to the downturn’s start. To me, this doesn’t feel like a time to be loading up on risk.
4. The US consumer is not as strong as everyone says
Another meme is that the US consumer will keep the global economy afloat. Now, I’m not saying that the opposite is the case, but let me just highlight a couple of data-points which are not in the flow of this narrative. Weekly Retail Sales growth on a 12-month moving average basis is up by 0.2%. That might not be terrible, but it’s still half the trailing 10-year median. Credit-card spending growth has been below its long-run average since early 2022 and is currently -1% year-on-year (YoY).
And then there’s the saving rate. Smarter folks than I have calculated that the pandemicera excess-saving piggy bank is empty.2 The current US saving rate is just over 3%. In the last cycle (2010-19) this averaged at 6%. What happens when (or if) this normalises?
5. House prices look healthy but are based on very few transactions
If you had polled the whole of Wall Street in 2020, asking them what would happen to house prices if mortgage rates moved from 3% to 8% in three years, how many would have forecast +35%? Residential real estate through this cycle has been the dog that didn’t bark – even through 2022 the drawdown was just 5% according to Case-Shiller data. The clichéd explanation is that people don’t need to move, because they’ve locked into a deal and don’t need to remortgage, thank you very much.
I’m less sure on this one, but I wonder whether this knife cuts both ways. In other words, are the prices we are seeing today the result of transactions between only a small portion of the population? Is this group less interest rate sensitive? The latest data from the National Association of Realtors gives a seasonally adjusted annualised number of 4.1 million existing home sales. The 30-year average is 5.3 million. The global financial crisis (GFC) trough was 3.5 million. If we revert to a more normal level of activity, as people are forced to move due to growing families or other changes in personal circumstance, might we expect to see ‘truer’ prices printed? As the memory of a 3% mortgage dims, perhaps folk may start to find 6% attractive. Next, we may see the realisation that, from a cashflow perspective, the numbers don’t add up, and the clearing mechanism is house prices. And the direction is downward.
6. Outside of the US, the global economy is weak
In all the talk of US exceptionalism, people sometimes fail to recognise the other side of the coin. The economic performance of the rest of the world has been decidedly unexceptional. The UK had a recession through the second half of 2023, based on the two consecutive negative GDP quarters rule-of-thumb. German growth was negative in four of eight quarters through 2022 and 2023. Japan machine tool orders have fallen 27% since the first quarter of 2022, despite a weak Yen presumably being a boon to exports. While there have been tremors of optimism in China so far this year, the property market, the nexus of the recent angst in that geography, shows no sign of improvement. Data from Jefferies suggests that the weekly residential floor space sold in the top 30 cities is flat on the year.
The US is between a quarter and a third of global GDP. Broad shoulders, for sure. But in my view not so strong that they can carry the world alone for much longer, unless their strength disperses more widely.
7. No sign of game change in productivity despite AI euphoria
My note of October last year3 suggested that AI might be overhyped in terms of its near-term economic impact. I haven’t seen anything since to make me doubt that. We are now a year-and-a-half into the revolution and, while we’ve all been going back and forth with Generative Pre-trained Transformer (GPT), and chief executives are obligated to tell investors how AI-integrated their businesses are, it’s not yet showing up in the data. Figure 3 shows three measures of US productivity, as set out in the note just referenced. The middle horizontal dashed line shows the trailing 10-year median. The two on either side are plus or minus one standard deviation. They’re not terrible by any stretch, but it doesn’t look like regime change yet.
NVIDIA is expected to sell four million datacentre Graphics Processing Units (GPUs) this year. This is enough to power 160 ‘SuperClusters’, used by the likes of Meta to train larger and more complex generative AI models, for the next five years. Whether the electrical infrastructure is in place to sustain these kinds of volumes is highly debatable. Here in the UK, National Grid’s large rights issue suggests not. But another concern is simply whether there is enough need for code-writing assistance tools and silly poems to justify that kind of development in the near term.
Figure 3. Three Measures of US Productivity Growth4
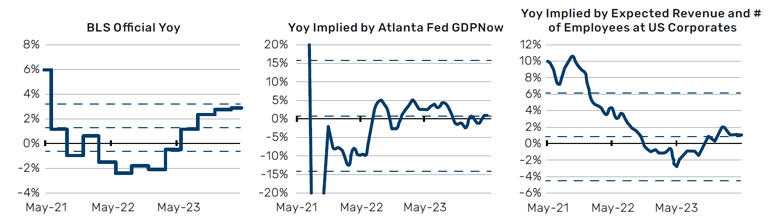
Source: Bloomberg.
8. The unintended consequences of a really fast tightening (even if we’re not at neutral)
A Federal Reserve (Fed) tightening cycle often breaks something in the financial plumbing. Not this time. We almost got there in March last year with Silicon Valley Bank and Credit Suisse, but the contagion ended up more limited than some anticipated. Don’t get too comfortable. A recent note from BCA, citing Federal Deposit Insurance Corporation (FDIC) data, showed almost $500 billion in unrealised losses on investment securities at the US regional banks. Still. We tend to think of prior financial plumbing accidents as developing faster than they really did. New Century went bust at the start of April 2007. The true reverberations would continue for another two years. It will hopefully not be that bad this time around, but the point stands that we should pay attention to early-warning signs.
9. The bond hedge will not be what it was unless it’s a BIG downturn
I discussed this in my 2024 outlook, as well as in an article on frameworks for thinking about fair-value yields.5 But to repeat in brief: we should not expect bonds to provide the same level of protection that they have done in prior equity sell-offs. Clearly bonds performed terribly in the 2022 equity drawdown, but even in a conventional disinflationary sell-off, this time around I expect duration returns to be positive but anaemic.
Since the Fed started targeting interest rates in the early 1980s, there have been six policy-easing cycles. During these, the 10-to-two-year portion of the yield curve steepened in every instance, and by an average of 117 bps. Today the curve is 37bps inverted: an unprecedented starting point if the cuts began now. So, you can make a credible argument that it will be a lot more this time around. But let’s take 117, to be conservative. In that scenario, assuming current levels of duration and carry, we would require three Fed cuts just to get 0% on the Bloomberg Global-Aggregate Total Return Index. Instead, a pathway of a 15-20% fall in stocks, and the Fed only cutting by say, 100 bps, is far from inconceivable. This is particularly possible, with the recent experience of inflation still in the backs of their minds.
Minus 30% is very different from minus 15%, of course, and a BIG crisis would very likely lead to the sort of shock-and-awe treatment of 2020 and 2008/9, but then we’d all have bigger problems…
10. Geopolitics…
Here’s some stuff that’s happened so far this year. Iran directly attacked Israeli soil for the first time. Israeli airstrikes destroyed part of the Iranian consulate in Damascus. An Egyptian soldier was killed in an incident involving Egyptian and Israeli troops on the border between the two nations. There is continued nuclear-sabre rattling from Russia over Ukraine. Taiwanese elections sparked fresh tensions in this region. You get the idea.
Geopolitics is not my bailiwick and so I don’t have a strong view either way. Indeed, it’s completely credible that we mosey along with the current state of tension, in a sort of suspended animation. My only observation is that implied volatility seems very low, all things considered. Figure 4 shows the average VIX level by calendar year. 2024 to date has only five years below it in the last 34: 1993, 1995, 2005, 2006 and 2017. Hindsight’s a wonderful thing, but all of these seem like worlds away in terms of the number of geopolitical fault lines on which markets danced.
Currently, on the S&P, selling a 109 call and an 80 put, while buying a 95 put is virtually free with a December 2024 maturity. Giving up upside above +9% in exchange for protection between -5 and -20% feels more valuable than that, in my view.
Figure 4. Average VIX Level By Calendar Year
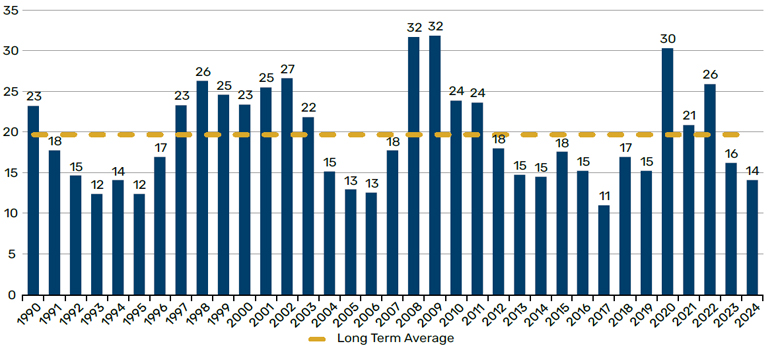
Source: Bloomberg.
Harder than it looks, but not set in stone
Investors, like most people, struggle with shades of grey. It’s either Value OR Growth. It’s either inflation OR unemployment. And the same is true for landings. Jackass or gymnast. The reality, of course, is that there are many gradations of hard. The difference between 2008 and 2018, for instance, is huge, both in terms of dollar profit and loss, and lived experience. I lean more towards the latter than the former. The question of landings should be approached like a Mohs Hardness Scale. I’m somewhere between Orthoclase and Quartz, for the geologists in the room. For everyone else, we’re talking about degrees of hard, rather than a soft/hard binary.
1. As discussed in a prior note:https://www.man.com/maninstitute/road-ahead-its-not-you-its-me-lessons
2. The San Francisco Fed for instance – see here
3. https://www.man.com/maninstitute/road-ahead-is-AI-overhyped
4. Source: Bloomberg and Man Group calculations. Alternative measure one takes average hours worked per week and total employees from the BLS monthly jobs report. It then estimates current real gross domestic product (GDP) using the Atlanta Fed’s NowCast model to calculate an implied YoY productivity growth. Alternative measure two takes the number of employees in the Russell 3000 and the Street’s 12-month forward sales estimate for the same. Assuming that the hours worked stays constant, we can calculate implied growth in sales per employee, a measure of productivity. We then deflate this by headline CPI. Both measures are smoothed on a 30-day trailing basis.
5. See https://www.man.com/maninstitute/road-ahead-bleak-house-2024-outlook and https://www.man.com/maninstitute/road-ahead-what-right-level-UST10
All sources Bloomberg unless otherwise stated.
You are now leaving Man Group’s website
You are leaving Man Group’s website and entering a third-party website that is not controlled, maintained, or monitored by Man Group. Man Group is not responsible for the content or availability of the third-party website. By leaving Man Group’s website, you will be subject to the third-party website’s terms, policies and/or notices, including those related to privacy and security, as applicable.