Key takeaways:
- Earnings drive equity markets – both in the short and long run. If you can accurately forecast corporate profits, you can predict market direction
- Earnings expectations are (almost) always revised downward. Most of the time, the market doesn’t mind, owing to the orderly and gradual pace of the downgrade
- Tariff-related uncertainty implies an elevated risk that the current downgrade cycle is disorderly and rapid
My last note concerned equity drawdowns and how to prepare for them. We are now in one. Or maybe, we’ve had one. Given that so much depends on the plans/whims (delete according to political persuasion) of the mercurial President Trump, I am hesitant to say too much that may end up wrapping the fish and chips before its time. Instead, here are some general reflections on earnings, with a particular eye to how earnings revisions have travelled through prior market crises. I hope this has more permanence, as well as offering an additional capitulatory indicator which can be applied to the current juncture.
Let us begin with some useful reminders. First, over the long term, if you know what earnings are going to do, you know what the market is going to do. As evidenced in Figure 1, over the long term, the price line and the earnings line are the same, with a couple of well-rehearsed aberrations. For a long-term investor, while multiple de-ratings might be your volatility, earnings will be your CAGR.
Figure 1: S&P 500 price and earnings 1871-2024
Problems loading this infographic? - Please click here
Source: Shiller, Man Group, as of February 2025.
This applies even to a short horizon. On a 12-month view, over the 150 years in Figure 1, if you knew the direction of earnings, you knew the direction of the market 66% of the time. Sadly (and obviously), you don’t. Fortunately, there exists a cottage industry whose participants pretend they do. Figure 2 shows the progression of the sell-side’s estimate for each calendar year’s earnings per share (EPS) from 1985 to 2027, alongside realised earnings over the full timeframe. In my nerdy way, I find this to be one of the more enjoyable charts to pore over. But if you just see a mess of strangely coloured spaghetti, jump on to the next paragraph, where I’ll give the vitals.
Figure 2: Calendar year EPS expectations for the S&P 500
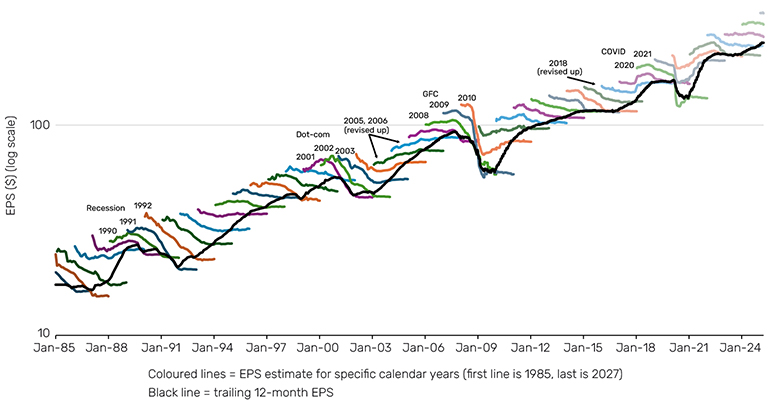
Source: IBES, Bloomberg, Man Group, as of 13 April 2025.
Earnings expectations are (almost) always revised downward. As highlighted in Figure 2, there are only three exceptions. The 2005 and 2006 forecasts began to be crunched in the aftermath of the dot-com bust, where there was still blood on the streets, and evolved through the earnings boom of the mid-noughties, accelerated by a consumer leverage bonanza. Unsustainable, as it turned out. Similarly, the 2018 projection began life in despondency coming out of late-2015/early-2016 China growth fears, and was then turbo-charged by the Trump tax cuts of late-2017. Despite being in this select group, 2018 ended up as a 6% down year for the S&P 500. In part, this was likely driven by the multiple refusing to reward such fiscal largesse, particularly in anticipation of the second part of the Trump programme, and one which is more pertinent today: trade wars.
But in the main, the giddy optimism which accompanies new year forecasts tends to follow the same path as the hopes and dreams of new year’s resolutions. Most of the time, the market doesn’t mind, because the pace of the downgrade is orderly and gradual, allowing the intrinsic growth of new-horizon years to enter the forecast window. In a crisis, this process tends to be fast-forwarded, such that the market can’t catch its breath to think about the longer-term future. Figure 3 gives some useful parameters. Each bar denotes the revision from the start of the estimate period to the end of the year in question. The average across all years is 14%. For recession and recession-adjacent years (the red bars), it is 24%. The current ‘live’ years (the green bars, being 2025, 2026 and 2027) have, as yet, done little. The 2025 projection is down 2.8%, 2026 is flat and 2027 is -0.3%.
Figure 3: Change in calendar year earnings estimate from start to end of the forecast period
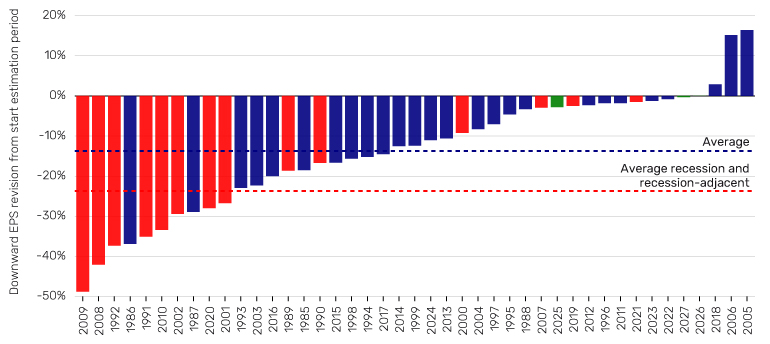
Source: IBES, Bloomberg, Man Group, as of 13 April 2025.
It is therefore justifiable to be concerned that tariff-related disruption is yet to be properly discounted in analyst estimates. The US blended tariff rate following Trump’s 90-day pause is generally estimated around 20%. A relief after the approximately 30% that was mooted as the outcome of the uncensored version, but still many multiples of the rate that prevailed at the start of the administration. And that is before we even start trying to factor in the disruption entailed by the dynamism/indecision (again, your call) of the tariff configuration paralysing corporate decision making. There should be at least some pain coming for bottom lines, in other words. Moreover, these big geopolitical macro events can have an amplified impact, as less scrupulous CEOs face the temptation to roll up unrelated bad news into the profit warning, such that it gets lost in the wider maelstrom.
Here's another way of looking at it. Figure 4 shows the 17 10%+ S&P 500 price drawdowns since 1985, when the earnings estimate data begins. For each, we show the magnitude of the S&P downward move, as well as the average earnings revision to ‘live’ years through that time (in other words, those calendar years whose EPS was actively being forecast). Of the 17 episodes, 71% see downward revisions measured on this basis. The five that do not are as follows:
- Jul-Oct 1999: the first tremors of the dot-com bust were valuation oriented, given the amping up of long-duration tech-driven expectations in preceding years. The multiple compressed 2.5 points in less than three months
- Mar-Apr 2000: as above. The compression here was two points in less than a month. In September, when the sell-off began in earnest, earnings estimates were not spared, even as the primary driver continued to be valuation
- Apr-Jun 2012: a mild correction and one more focused on the macro issue of eurozone fractiousness rather than near-term US corporate profitability
- Nov 2021-Oct 2022: an inflationary sell-off which, in the near-term, flattered earnings which are reported in nominal terms. While there was a downward revision, it came later, as the productivity-sapping nature of unexpected price accelerations weighed on margins
- Jul-Oct 2023: a move centred around the bond market and fiscal sustainability concerns, with little implication for near-term equity fundamentals
So, yes, there are edge cases where it is possible for the market to sell off without meaningful downward revision. But, based on broader precedent, you’d expect a bit more, particularly given the nexus of the current iteration is the global efficiency of the near-term corporate supply chain.
Figure 4: 10%+ S&P moves since 1985 with corresponding earnings revision
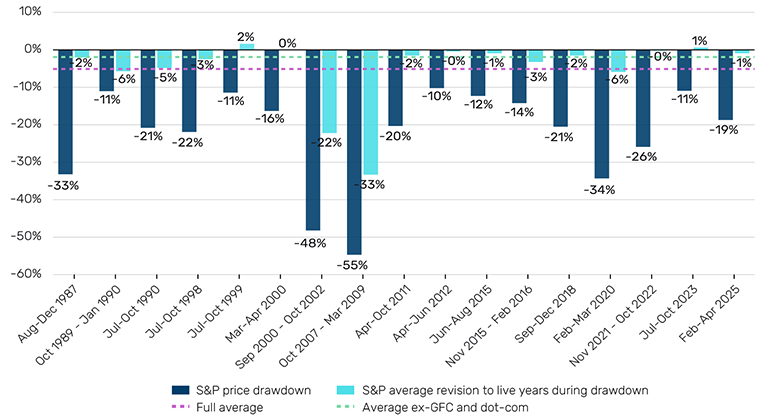
Source: IBES, Bloomberg, Man Group, as of 13 April 2025.
The 6% rally in the S&P 500 from Trump’s victory in November 2024, to the peak on 19 February, was driven both by valuations and near-term fundamentals. The former, described by the multiple, reflected a revival in AI productivity miracle euphoria. The latter, described by earnings expectations, was driven by hopes of Trump’s mooted programme of supply-side reform: deregulation, tax cuts and DOGE. The interesting aspect of the current sell-off is, thus far, it has been largely de-rating driven, with the S&P multiple down almost three points at the time of writing. If the trade war turmoil muddies the water of the supply-side narrative enough, the next leg down could be driven by near-term fundamentals, as tariff-related profit warnings start rolling in. That being said, the convexity of the current juncture is high. This tariff-card can pivot on a dime, as we have seen, and there are undoubtedly vocal backers of profound red tape immolation, a boon for near term bottom lines. My bias continues to be for the more pessimistic pathway. But in a minute there is time for decisions and revisions which a minute will reverse.
You are now leaving Man Group’s website
You are leaving Man Group’s website and entering a third-party website that is not controlled, maintained, or monitored by Man Group. Man Group is not responsible for the content or availability of the third-party website. By leaving Man Group’s website, you will be subject to the third-party website’s terms, policies and/or notices, including those related to privacy and security, as applicable.