“And from the hallowed halls of every large investment bank come pages and pages of ‘outlook’ research.” This from the 1 December edition of The Economist. Now don’t get me wrong, I enjoy kicking the investment banks as much as the next man. Still, it did strike me as a tad rich given that, just one week prior, I had been subjected to a 90- page 2024 outlook from the same paper. Side swipe over, here’s mine.
This is not a house view, because we don’t have one. But it is somewhat bleak. Hopefully not so much as to have you weeping into your eggnog, but not the first breath of spring on the Champs-Elysees either. For those who are really in a hurry, here’s the bottom line for estimated 2024 total returns: S&P 500 Index -0.1%, US 10-year Treasuries (UST10) +4.0%, USD investment grade (IG) +2.0%, USD high yield (HY) +1.8%. How do I get to these? You’ll have to read on, but in short, all a bit meh. One of those days of permanent drizzle where it never gets fully light.
A wise man once said, give a number or a timeframe, but not both. I’ve already broken that rule. Here’s further throwing caution to the wind.
Figure 1. US Equity and Bond Returns by Calendar Year, 1800-2024

Source: Shiller, GFD, Bloomberg, Man Group calculations. 2023 number is to end November. 2024 is a purely subjective estimate. Stock-bond correlation are calculated on monthly periodicity.
Base case for 2024, as indicated, is we are in the bottom right quadrant. Not epically so, but US equities marginally down, bonds returning their carry but not much else besides. The risks, however, are to the downside. Let’s start with equities.
Equities: -0.1%
For the S&P in 2024, the Street is forecasting 5% revenue growth with 140bps of margin expansion. Figure 2 shows how this would compare to that which was realised in prior calendar years (light blue bar is the current forecast value for 2024).
Figure 2. S&P Calendar Year Revenue Growth (Top) and Operating Margin Change (Bottom)
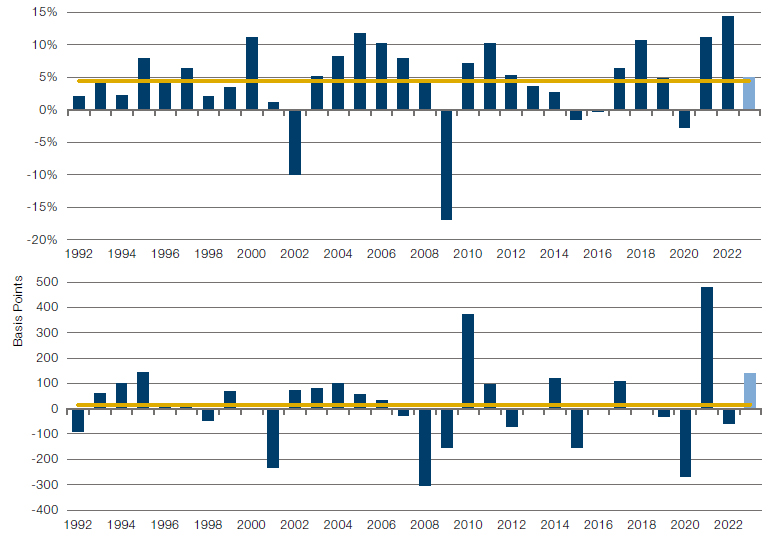
Source: Bloomberg, Man Group calculations. Light blue bar denotes the Street’s projection as at the end of November 2023.
Per the top panel, anticipated revenue growth of 5% would be above the long term average, and follows two stellar years. Indeed, if this estimate is right, the 3-year rolling top line growth at the end of 2024 will be 33%, a rate only surpassed by the 34% hit at the end of 2006. Does this feel likely in a world where we’ve had the fastest monetary tightening since the early 1980s, credit conditions as measured by the Senior Loan Officer Opinion Survey (SLOOS) at their most unfavourable since the Global Financial Crisis, and the labour market beginning to roll (even if levels remain attractive)? I would say, no.
But starker still is the margin expansion. Per the bottom panel, the Street has +140bps on the books. In the last three decades, there have only been three years ahead of this: 1995, 2010 and 2021. Does this feel likely in a world where wage inflation remains at an elevated level, even when overall CPI is rolling, as the headlines constantly remind us? The money illusion is over and with between 73-84% of global market cap (depending on how you count it) going to the polls next year, the political tolerance for price rises, never massive, is going to be even more limited.
Now some will say, the Street is often too optimistic, and it gets bailed out by multiple re-rating. This was the playbook of the 2012-2019 period. In all but one (2018) of those eight years, calendar year earnings missed start of year estimates. In the seven which missed, the average magnitude was five percentage points. And yet the S&P price kept rising, thanks to the multiple going north. Of course, the difference then was that starting multiples were lower. 15x on average. Not 19x. If AI comes down from the heavens in a form that lots of people can use, then all bets are off. But as I previously wrote (see https://www.man.com/maninstitute/road-ahead-is-AI-overhyped), I think that’s a three-to-five year thing, not 2024.
My best guess; earnings growth is about half of what the Street expects and we lose a point on the multiple. Gets us to fractionally below flat. As per the mooted 2024 circle in Figure 1.
Bonds: +4.0%
That brings us to duration. I’ve been constructive for the last three months, but the violence of the November move has lessened my conviction. In absolute return terms the likely magnitude of the next move, in either direction, feels limited. The top panel of Figure 3 shows US cash rates with hiking cycles shaded yellow. The text labels show the basis point change in the 12 months following the last hike. The bottom panel shows the same but for the 10Y-3M yield curve.
Figure 3. Effective Fed Funds Rate (Top) and 10Y-3M Yield Curve (Bottom)
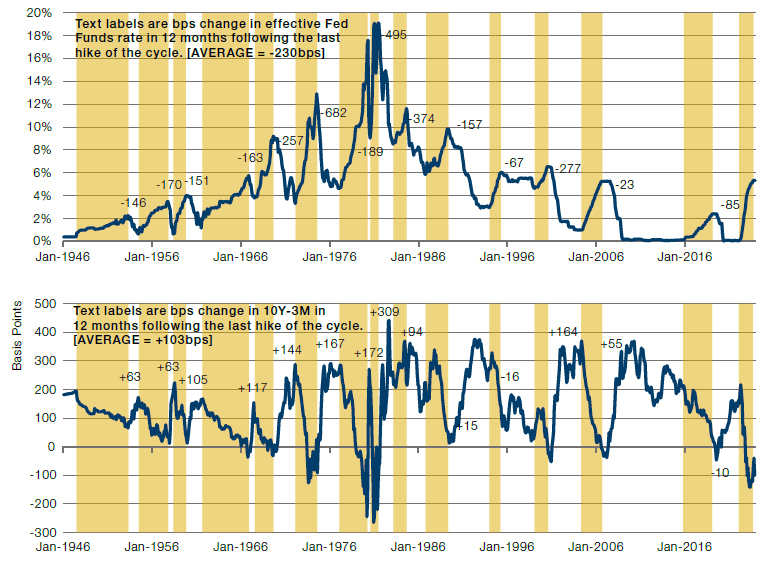
Source: Bloomberg, GFD, Man Group calculations. Hiking cycles shaded in yellow, defined optically.
Based on this historic context, my mental model incorporates three scenarios:
1. AVERAGE (35% probability): there have been six hiking cycles where rates ended at a similar point to today (2nd, 3nd, 4th, 11th, 12th and 13th). The average subsequent cut across these is 140bps. There are three hike cycles which have finished with the curve at a similar level of inversion (6th, 7th and 8th). On average the subsequent curve steepening was 215bps. This would equate to UST10 yield @ 4.9%
2. SOFT LANDING (45% probability): let’s say they do just one cut (as was the case after the final hike in 2006). And let’s take the average of the curve steepening in the three prior hike cycles commonly seen as soft landings (4th, 10th and 11th) = +40bps. This would equate to UST10 yield @ 4.3%
3. HARD LANDING (20% probability): call it 300bps(?) of cuts. Chosen slightly arbitrarily but just looking at prior cycles that would be historically significant. Let’s imagine we get the same curve steepening per (1). This would equate to UST10 yield @ 3.3%
Doing the ‘math’, that comes to a probability-weighted estimate of 4.3% for fair yield in the short term. In other words, similar to where we are now. So in total return terms that means you get about 4%, with all of it coming from carry.
Note the implication of these three scenarios. Something in between a soft landing and a very mild recession is the base case, but there remains a one in five chance of something much nastier. Driven by elevated risks discussed in prior notes: geopolitics, financial plumbing, housing, debt rollover etc. In that eventuality, equities are down much more than our prior discussion implied.
Credit: +2.0% (Ig) / +1.8% (Hy)
A final word on credit. I find both IG and HY spreads unappealing, and particularly so for the latter. At 106 and 387bps, respectively, USD IG and HY are pricing in cumulative 5-year default rates of 0.7% and 12%.1 This compares to long term realised averages of 1.0% and 17%, according to 100 years of Moody’s data. Does it seem reasonable that the default environment at this stage of the cycle is better than long-term norms, and five points better in the case of HY?
In Figure 4 I try to approximate some quantum of what spread widening is consistent with the bearish equity view already described. The chart shows, by calendar year, the relationship between the percent move in the S&P and the IG (yellow) and HY (blue) spread widening / tightening.
Figure 4. Relationship Between S&P Returns and Spread Widening
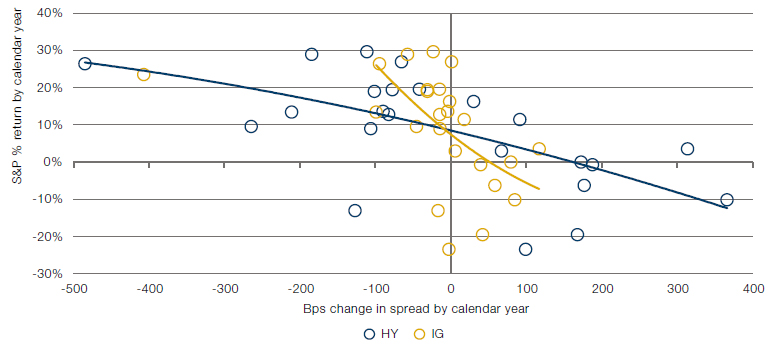
Source: Bloomberg, Man Group calculations. IG and HY indices are from Bloomberg Barclays. Axes are cut off for sake of visibility. Trend lines exclude 2008 and 2009.
Historically, a flat S&P year has been consistent with +50bps of IG widening and +170bps for HY. Put another way, target spreads of 156 and 557. By-the-by that would take implied default rates on the same methodology I mentioned earlier to a much more reasonable 1.0% and 17%, in line with long run averages. In total return terms this translates to +2.0% and +1.8%.
Some Concluding Remarks, Given With Much Humility And A Compliance Disclaimer
We’re all fumbling in the dark. I’ve been wrong plenty of times. This is not investment advice and do your own research. All that being said, here are three things I’m going to be considering in my strategies.
1. Levered risk parity over 60/40 and its bed fellows. None of the projected returns here discussed are that exciting. That being said, fixed income, both duration and credit, is in my view likely to outperform equities. I also think the stock-bond correlation has got ahead of itself and, while the long-term outlook is for structurally positive readings, shorter term I expect some moderation, particularly as inflation volatility declines (hence the 2024 circle in Figure 1 is smaller than in the previous two years). By my reckoning, at the portfolio level this works out as about seven bond for every three equity units.
2. Cheap hedges against equity gap risk in the event we get something akin to scenario (3) of my possible rates paths. Examples include:
a. JPY. It’s really cheap. On the USD cross around 40-50% below fair value, depending on whose version of purchasing power parity you want to use. Yield curve control is going to end. The market will swing back and forth on varying Bank of Japan tone, but the direction of travel is clear. And if we do get a fast pain scenario it may benefit from its traditional safe haven status.
b. Brent futures. Per Figure 5, most commodities are more contango-ed than is typical. Oil is more backwardated. Thus you have more of a roll yield cushion to tide you over while you wait for (e.g.) one of the (now multiple) geopolitical risk events to escalate further. But careful with this one, as although it will benefit from a 2022 style supply shock sell-off, a demand-led downturn like 2008 or 2018 would be very different.
c. VIX. At 13% it is in the 16th percentile of historic readings. I know the purists will witter on about skew and it being more complicated. But that still feels wrong. The risk environment is not in the 16th percentile of historic readings. Or indeed anywhere close, in my humble opinion.
3. More alternatives, more alpha. Any of the shock scenarios anticipated in (2) are good for dispersion. And with traditional premia compressed, sensibly constructed alternative premia are warranted.
There we are. Come back and mark my homework this time next year. And in the meantime, thanks for reading through 2023, and I wish you a very happy Christmas, and a prosperous 2024.
Figure 5. Commodity Futures Curves, Current (Solid Lines) versus Trailing Eight Year Averages (Dashed Lines)
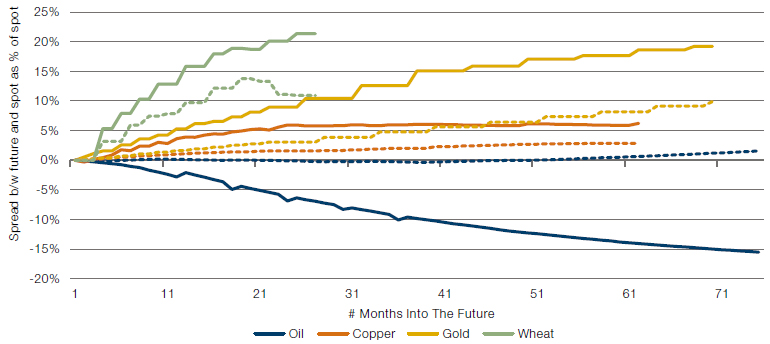
Source: Bloomberg, Man Group calculations.
1. Data as at end November. Calculation assumes a 40% recovery rate and continuous compounding and is calculated by taking the portion of the spread compensating for default risk (as opposed to downgrades) and dividing by 1 minus the recovery rate.
Source: Bloomberg, Man Group calculations, unless otherwise stated.
You are now leaving Man Group’s website
You are leaving Man Group’s website and entering a third-party website that is not controlled, maintained, or monitored by Man Group. Man Group is not responsible for the content or availability of the third-party website. By leaving Man Group’s website, you will be subject to the third-party website’s terms, policies and/or notices, including those related to privacy and security, as applicable.