Key takeaways:
- On the one hand, gold appears overvalued. It has historically underperformed equities over the long term and is only passable as an equity left-tail hedge
- On the other, many of the alternatives are also expensive, gold has been valuable since the dawn of time, and it stands to be a key potential beneficiary of de-dollarisation
- To me, this sums to a low but present allocation. If you want to get cute, I would split that between futures, bullion, miners, other precious metals and crypto
“This is gold, Mr. Bond. All my life I’ve been in love with its colour … its brilliance, its divine heaviness.” - Auric Goldfinger
Few would go so far as to dip someone in the yellow metal, thus causing their untimely death. Yet many of us can empathise with Ian Fleming’s eponymous villain. Gold is intoxicating. But something can appeal to us emotionally and aesthetically, and still be a rubbish investment.
Figure 1 shows the three-year cumulative return of the auric element since the dissolution of the gold standard, and therefore the era of full price discovery. On the one hand, the price has almost doubled since June 2022. On the other, we remain well below the +350%, +400% and +150% levels reached in 1974, 1980 and 2011 respectively. That makes the age-old conundrum of what to do with your gold allocation even more prescient.
Allow me to hold your hand (either) through four important questions with, I hope, important answers.
Figure 1: Three-year change in the gold price
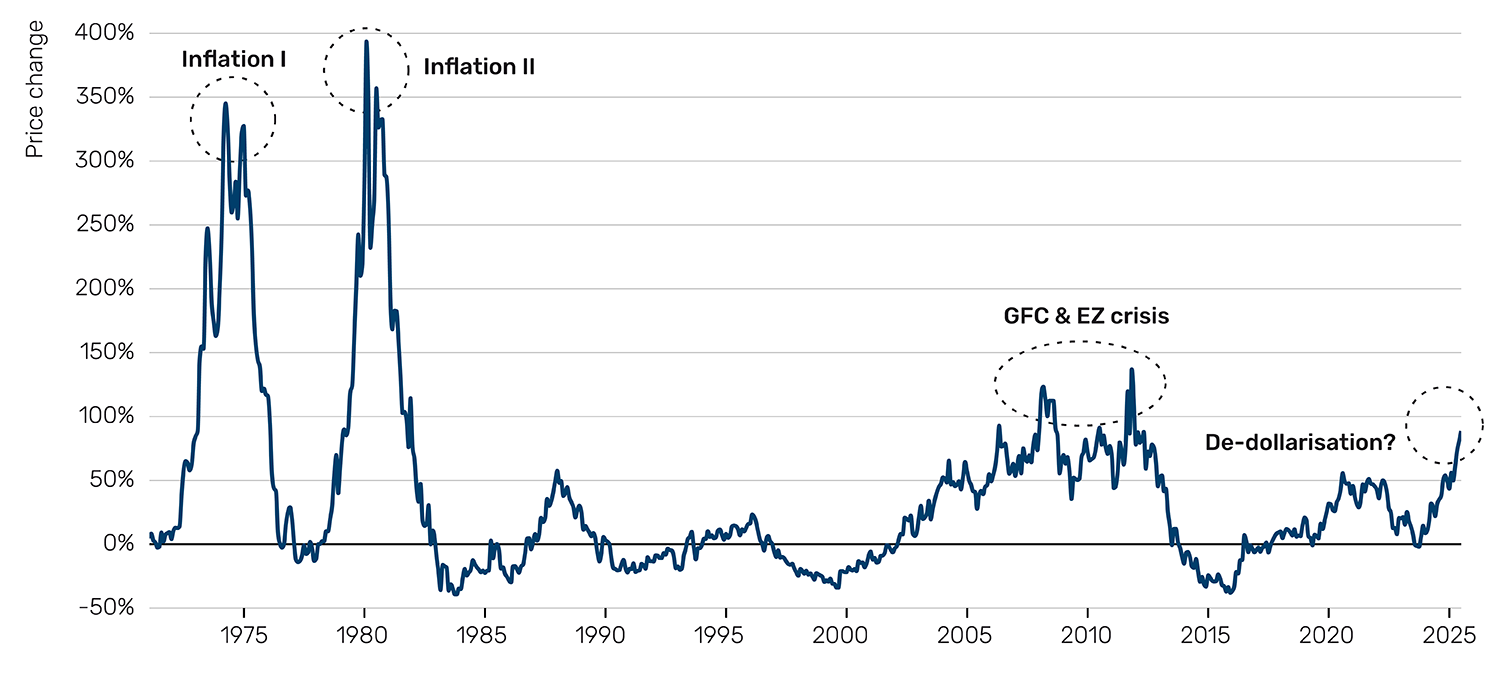
Source: Bloomberg, Man Group, as of 19 June 2025.
Is gold expensive?
In my view, yes. But how can you value an asset without cash flows? The cry goes up from the DCF jockeys. Allow me to make three proposals.
First, to what extent is gold’s inverse correlation with real rates intact? While not strictly a valuation metric, as discussed in last month’s note, if the relationship is broken, it suggests there is some detachment from fundamentals. Gold is a yieldless asset, after all, so it tends to perform worse when the opportunity offered by yields is higher.
Secondly, what multiple of its extraction cost does gold trade at? People have been digging the stuff up for quite some time, so it doesn’t seem mad to assume that some margin equilibrium should have developed. If that relation is violated, it may be a sign of greed (or fear).
Thirdly, what percentage of global wealth does gold represent? Store-of-value has always been a key tenet of the argument for your average gold-bug, and justifiably so, as we shall see. So again, we would expect its relation to the world’s value store to be relatively constant.
In Figure 2 we show three measures relating respectively to these three frameworks. There is a data issue here, it being hard to go back much into the 20th century (US TIPS only began trading in 1997, for example, and thus knowing what real rates were prior to that is speculative). But our analysis suggests that gold is likely at its most overvalued in at least a quarter of a century.
Figure 2: Three methods for determining gold valuation
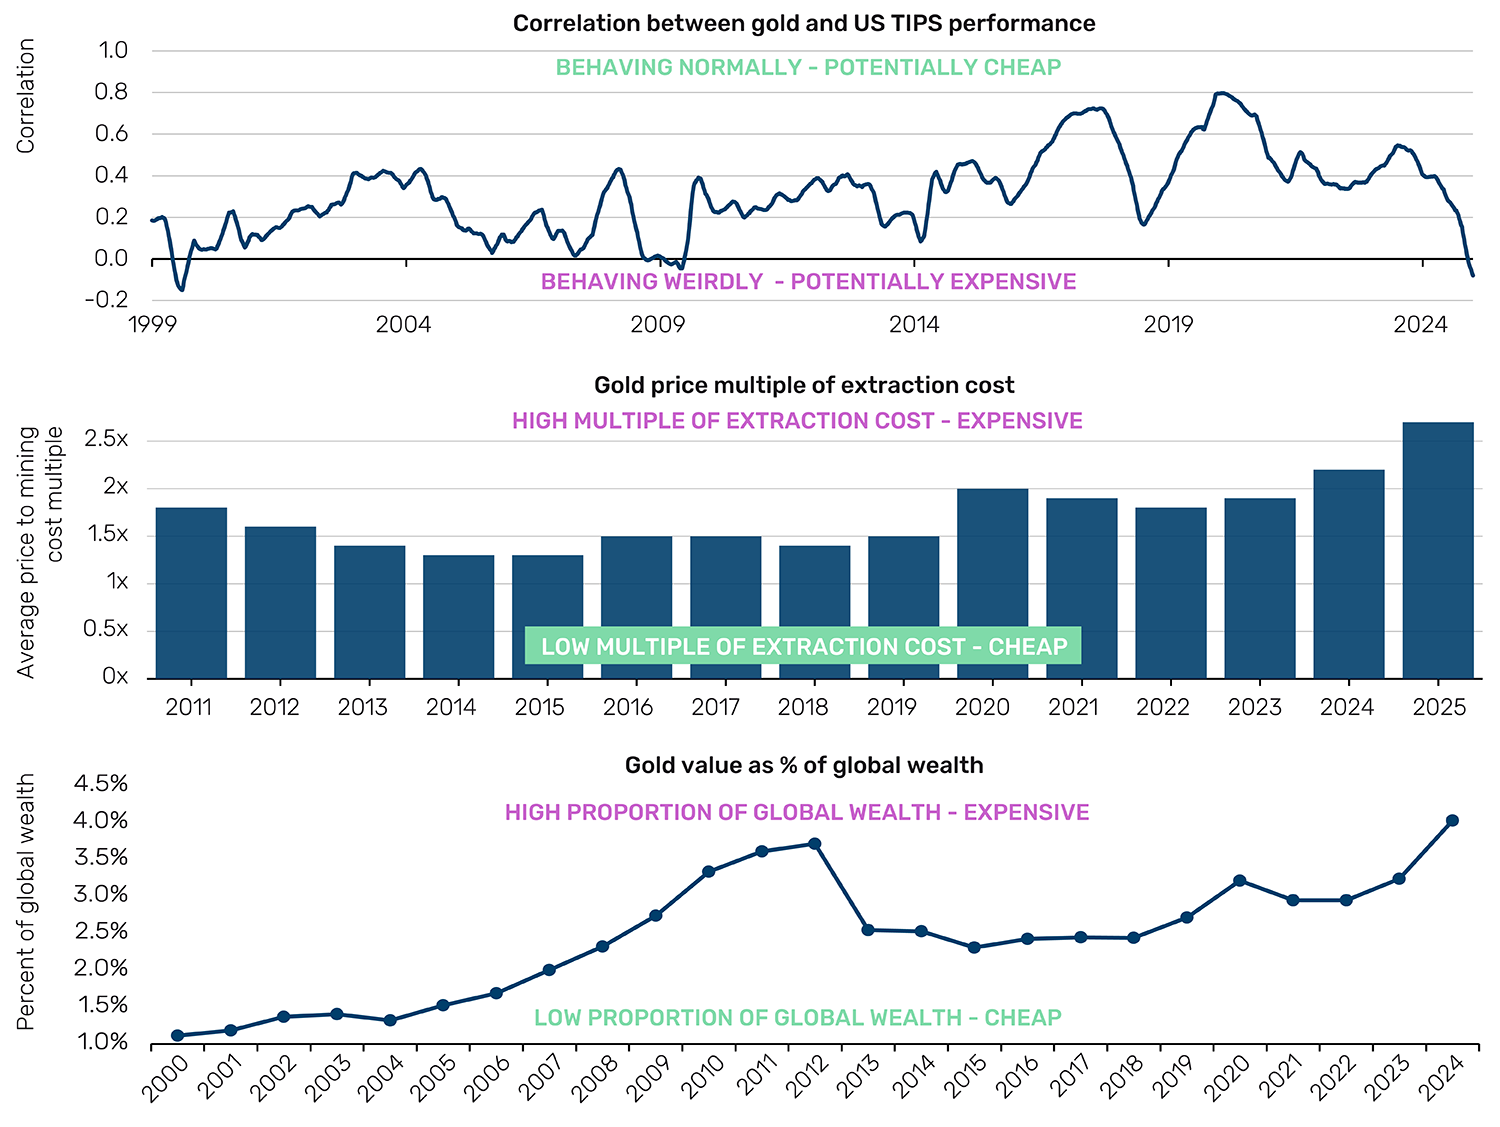
Sources: Top: trailing one-year correlation between gold and Bloomberg Barclays US TIPS TR, smoothed on a three-moth moving average basis. Middle: Bloomberg, World Gold Council, Man Group calculations. Multiple based on 90th percentile efficient miner. Bottom: UBS Global Wealth Reports, World Gold Council, Bloomberg, Man Group calculations. All data as of 19 June 2025.
Does gold keep its value over the long term?
Yes. But so do other things.
Records suggest that in England in 1257, you could pick up an ounce of gold for the equivalent of US$4.10. The current price is around US$3,400, which equates to just shy of 0.9% price appreciation per annum over seven and a half centuries. Over that same time inflation has been very slightly above 0.8% a year.1 So, over the spectacularly long term, the evidence is that you will increase your purchasing power by seven basis points a year holding the yellow metal. And depending on your vantage point, even this meagre increment might be unattainable. As recently as 2019, the gold index and the inflation index would have been identical on a 750-year view. And, indeed, on overlapping 50-year windows on the same basis, inflation outpaced gold in 58% of instances.
So there’s a good chance you keep up with inflation over the long term, but it’s by no means guaranteed. And if you really do have a half-century view, you should probably be in stocks anyway. Figure 3 shows the 50-year annualised return of gold and UK/US stocks back to 1742. There are really only four episodes when you would be better off in the shiny stuff on a half century look back: respectively, the Americans giving Mother England the slip, the Americans squabbling amongst themselves, the 1970s inflation, and the dotcom/Global Financial Crisis decade.
81% of the time, stocks have outperformed gold on this basis.2 Now this doesn’t mean there weren’t times when you wouldn’t have been very happy to have it. In the 10 years from 1969 to 1979, for instance, the third episode mentioned above, the commodity outperformed by 29% percentage points annually, or 1,186% total. But all in all, if you’re too heavy in gold and too light in stocks, you might be being a bit too clever.
Figure 3: 50-year annualised return to gold and stocks
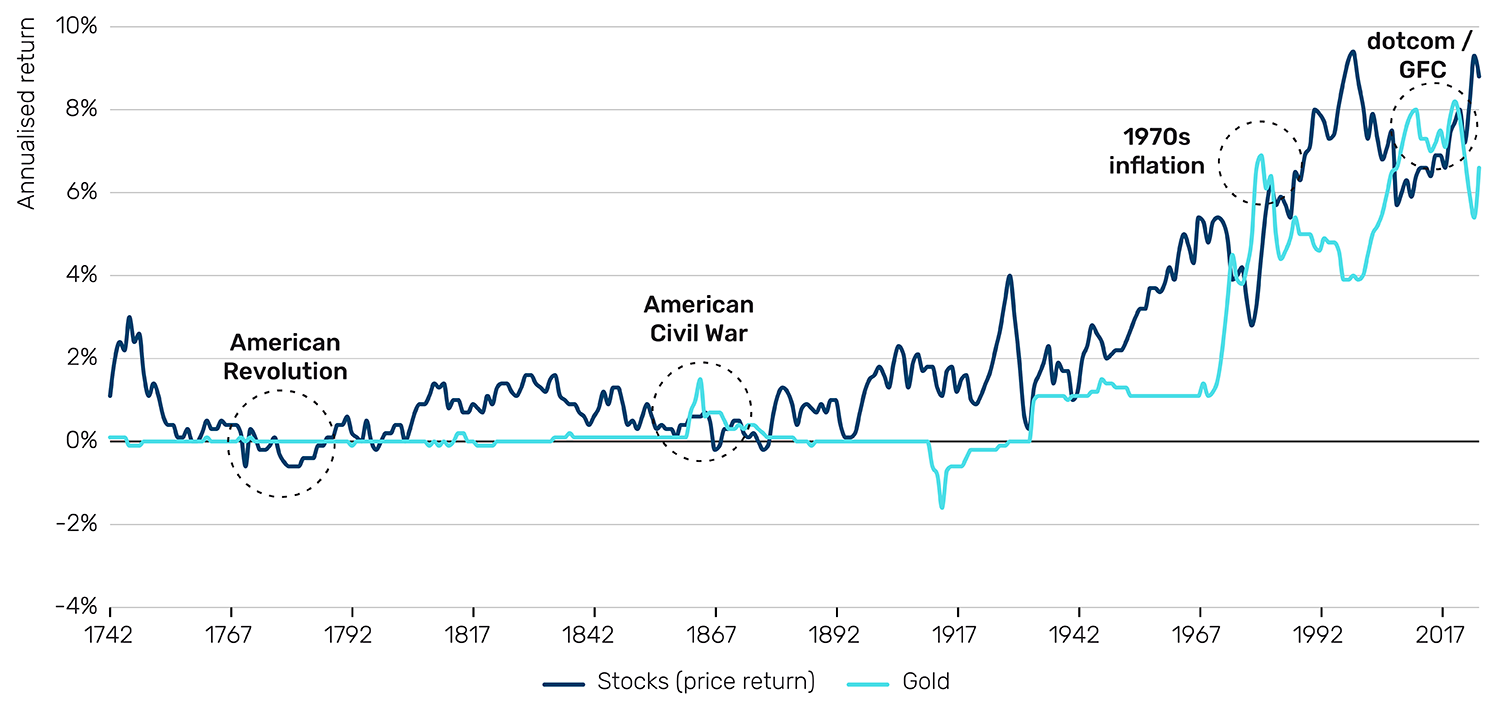
Source: GFD, Man Group calculations. Stocks are represented by the UK until 1871 and UK thereafter. Data as of 19 June 2025.
Gold miners or underlying?
At least some of the former, especially now.
As discussed in our first section, the metal is probably at least a bit expensive. The gold miners, by comparison, are not. The NYSE ARCA Gold Miners Index, for instance, currently trades at 12x the next 12 months’ earnings. That’s around the 11th percentile over the last 20 years.
Figure 4 shows the relationship between the gold miners’ relative performance against broad stocks, and gold itself. I have also shown the same for copper and crypto, lines of best fit only, for ease of visibility. This will be relevant for the next section, so hold the thought. For now, note the decently fitted trendline for gold, and the heuristic that, holding a long/short miners versus equities position, you typically see three times the move of the underlying.
And it’s not just relative cheapness that gold equities have going for them. It’s also less faff. If you’re holding the underlying in physical form you’ve got to think about where to put it, how to guard it, who your intermediary is. If via futures you’ve got to remember to roll them, as well as having a view on the shape of the forward curve. Sounds like hard work.
Figure 4: Weekly performance of commodity equities versus pertinent commodity
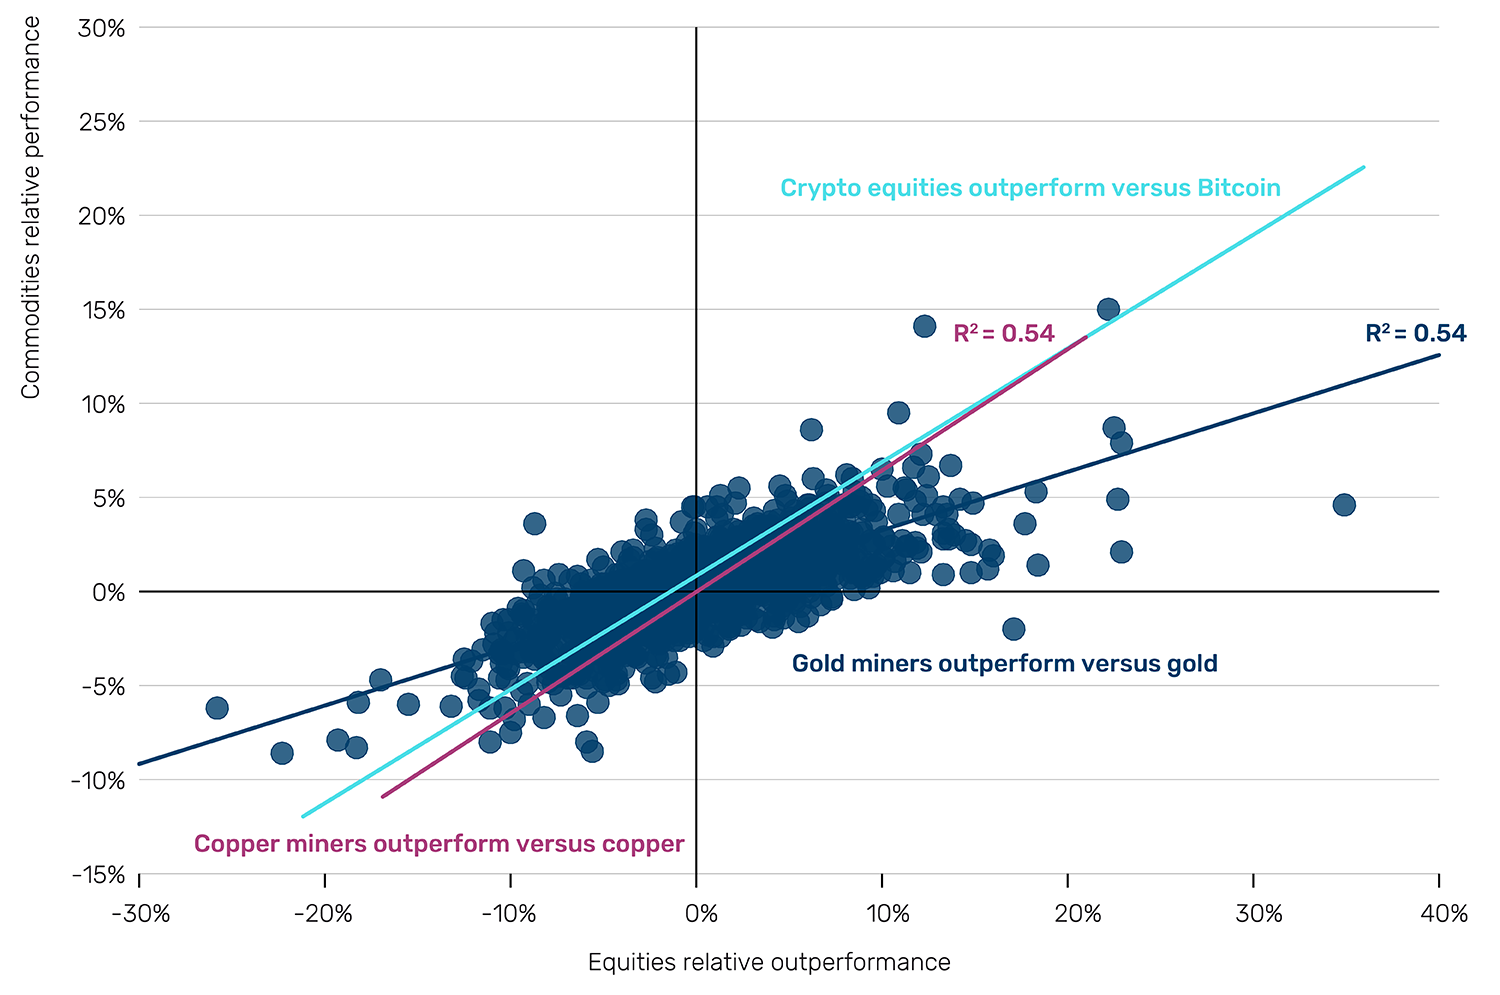
Source: Bloomberg, Man Group calculations. For gold miners, we use the NYSE ARCA Gold Miners Index. For copper miners, Solactive Global Copper Miners Index. For copper miners, Solactive Global Copper Miners Index. For crypto, MVIS Global Digital Assets Equity. All against S&P 500. Gold data back to 1993, Copper to 2006, Crypto since 2021. All against MSCI World. Data as of 19 June 2025.
Is digital gold a gimmick?
Perhaps. But worth a punt.
In my view, Bitcoin has three potential return drivers:
- Digital gold: limited in supply, little productive capacity other than store-of-value (don’t pretend you’re using it to buy the next round)
- Tech beta: despite being around for 15 years, it’s still a solution in search of a problem. Its duration is high, both in terms of time and complexity. Essentially, it is similar in character to other bleeding-edge technologies
- Cyclical beta: it still has a heavy retail skew in terms of its investor base. Without wanting to patronise, *necessary throat clearing when you’re about to*, this is a segment which is potentially more easily buffeted by cyclical economic winds
Back to Figure 4, and note how similar the light blue and pink trend lines are. If it looks like a duck and quacks like a duck … it’s probably not a horse. Given that copper is a cyclical bellwether, to me this is evidence that, at least for the time being, crypto is behaving more like a digital cyclical than digital gold. The one-year trailing correlation between Bitcoin and gold is 0 (weekly periodicity). Over the past three years, it has been +0.1. It has shown no sign of moving structurally higher.
And yet…
Figure 5 shows the performance of gold and Bitcoin in each of the last 10 S&P drawdowns of 10% or more (Bitcoin is missing the first one because it didn’t exist). There’s a couple of interesting observations coming out of this. First, note that gold’s historical performance as a left-tail hedge is not nearly as good as some might expect. It’s negative in four of the 10, and on average saves you just a tenth of the equity drawdown magnitude. And secondly, while it might be generally true that gold is an equity left-tail pain reliever, while Bitcoin is a pain enhancer, the fiscal-sustainability-driven sell-off of July to October 2023 (the dark pink bar) was positive for digital gold, and indeed more so than for the physical stuff. Debt concerns wobbling fiat currencies are a key pinch point gold is meant to protect against. The VERY early (not to mention limited) evidence is that Bitcoin might have a place in protecting portfolios in a similar manner.
Figure 5: Gold and Bitcoin in S&P 10% drawdowns
Problems loading this infographic? - Please click here
Source: Bloomberg, Man Group, as of 21 April 2025.
In conclusion, what to do…
In the title theme of Goldfinger, Shirley Bassey warns that our chrysophilic rogue “beckons you into his web of sin. But don’t go in”. I’d qualify her advice with “don’t go all in”.
Gold has had a very strong run over the last 18 months. Yes, the 1970s rallies were many multiples of the current upswing, but even if you are concerned about a 70s-style structural inflation, the big difference between now and then is that decade came on the heels of the dissolution of the gold standard. We should not be surprised that killing the switch on a centuries-long managed market, in an inflationary environment, led to runaway performance in ‘real’ money. Gold is expensive in that it is currently trading untethered from its fundamentals: real rates, cost of extraction and percentage of global wealth. On a 750-year view it has kept its value, but only just, and there have been long periods of time where it has lagged behind. History tells us that it underperforms stocks most of the time, and is only a passable equity left-tail drawdown hedge. Moreover, its volatility and drawdown profile, per Figure 6, is high, indeed not that dissimilar to stocks themselves.
All of which hardly sums to a bull case. And indeed if I had to choose now between a large allocation and no allocation, I’d plump for the latter. But … it remains an asset with literally thousands of years of legitimacy. Arguably the oldest investment. The Bible says it was valued even in the Garden of Eden.3 So, since the birth of humanity, in that telling, and the true one, in my view. Moreover, while it might be true that gold is expensive, so are stocks, so is credit. On a relative basis then, perhaps that argument is weaker. Plus US fiscal sustainability (and de-dollarisation in general) is certainly one of the potential equity sell-off catalysts today. In that environment gold would likely perform strongly.
Decision time, I think. This comes out at an allocation, but a low one. Perhaps 2.5% of your total portfolio, if I had to give a number, the proportion of global wealth it consistently represented in the period of stability between the eurozone Crisis and COVID (see Figure 2, bottom panel). If I was going to get cute I would divide that allocation into five sub-books, as follows:
- Gold futures – 30% – short end of the curve, say three months
- Gold bullion – 30% – in your own safe if you back your home security, otherwise via an exchange-traded commodity (ETC) with specifically allocated bars
- Long global gold miners / short global stocks – 15% – ideally get someone who knows the space to do this for you, given the geopolitical risks inherent in the regions where lots of mining assets sit
- Other precious metals – 20% – equal weight across three-month futures in silver, platinum and palladium
- Crypto – 5% – split 80/20 between Bitcoin and long crypto equities / short global stocks
Of course, if you’re a true gold-bug who thinks the zombie apocalypse is coming, then you should ignore the above nuance, and just put the whole portfolio into small-denomination gold coins. Then again, if the living dead are really coming, you’re probably better off stocking up on ammunition.
Figure 6: Risk (vol. [top] and drawdown [bottom]) of stocks and gold
Problems loading this infographic? - Please click here
Problems loading this infographic? - Please click here
Source: GFD, Bloomberg, Man Group calculations. Weekly periodicity data, as of 19 June 2025.
1. UK until 1789, then moving to US.
2. And this is on a price return basis. Given a dividend yield of around 3% for stocks, and negative carry for gold (usually) on a total return basis the comparison would be even more stark.
3. Genesis 2.11-12.
You are now leaving Man Group’s website
You are leaving Man Group’s website and entering a third-party website that is not controlled, maintained, or monitored by Man Group. Man Group is not responsible for the content or availability of the third-party website. By leaving Man Group’s website, you will be subject to the third-party website’s terms, policies and/or notices, including those related to privacy and security, as applicable.