In a recent podcast, Nicolai Tangen, CEO of the Norwegian Sovereign Wealth Fund, interviewed Sam Altman, his opposite number at OpenAI.1 Mr Tangen, clearly a hard charging sort of fellow, informed Mr Altman that he had challenged his employees to deliver 10% productivity growth over the next 12 months, with the new assistance available to them through ChatGPT and associated tools. Admitting that he had pulled this number ‘from thin air’, he asked for a more educated estimate. Mr Altman responded that he thought it could be double that.
20% productivity growth in 12 months got my attention. Particularly given the type of entity in question. The Norwegian Sovereign Wealth Fund has no shareholders, at least in the traditional sense. Its purpose, according to its website, is to ‘safeguard and build financial wealth for future generations’. In other words, to generate investment returns over and above inflation. Productivity growth in this context means to produce more risk-adjusted returns, for a given unit of employee effort.
As someone who’s in a similar line of work, this made me wonder, if I had twice as much time would I return twice as much alpha. Or, a more mischievous sort might say, if I had twice as much time would I generate any more alpha. Unclear.
For other kinds of business, the link appears more obvious. It seems reasonable that if an oil exploration company had twice as much time, it would be able to dig up, if not double, then at least a good deal more of the stuff. And a similar case could be made for a supermarket, or a hospital, or a semiconductor fab, and so on.
So that’s why the 20% number made me sit up. Of course, one takes it with a pinch of salt; Altman was on the spot, likely talking his own book to some extent, and if pushed would probably attach a bunch of provisos. But still, if he’s even semi right, to me it seems likely that the broader economy’s productivity growth will be staggering, and you won’t have to do the old fudge of smoothing 10 year trailing. It will be right now, in 2023 and 2024.
But here’s the problem: we’ve already had ChatGPT for almost a year and so far, at least in the official data, we’ve seen… not very much. Figure 1 shows quarterly productivity growth, as measured by the Bureau of Labor Statistics, with associated long term historic percentiles (the dashed horizontal lines).
Figure 1. US quarterly productivity growth
Problems loading this infographic? - Please click here
Source: Bureau of Labor Statistics, Bloomberg. 25-50-75th percentiles are since the BLS started collecting the data in 1947.
Productivity growth from ChatGPT’s invention to the end of June has averaged at around 1.3% quarter-on-quarter annualised. That is 41st percentile of historic readings back to 1947. Now, fair enough, the most recent quarter clocked at 3.5%, or 70th percentile. But 20%, it ain’t.
The counter to this is two-fold. And both folds are very legitimate. One is that the official productivity data is published with such a lag that it loses much of its utility. We won’t know the results for Q3 until November, for instance. And secondly, there are methodological concerns. There’s a special place in hell for chin-strokers who claim mismeasurement, but it does seem not unreasonable that when sudden technological shifts occur, there may be some catch up required.
Thus in Figure 2 I show two ways that I look at productivity growth on a day-by-day basis, and from different data sources. The yellow dashed line uses the AtlantaFed’s GDP nowcasting model and the monthly jobs report. Green tracks revenue growth and number of employees in aggregate across the Russell 3000. The navy blue solid line is the average of the two. Full details in the source note. The world is divided into those who read footnotes and those who do not. I don’t. So I don’t blame you for following suit.
These tell us productivity growth right now is running somewhere between -1% and +4%. Point estimate +1.5%. And hasn’t shown any indication of breaking out over the last 12 months.
Figure 2. US productivity growth year-on-year, Alternative Measures
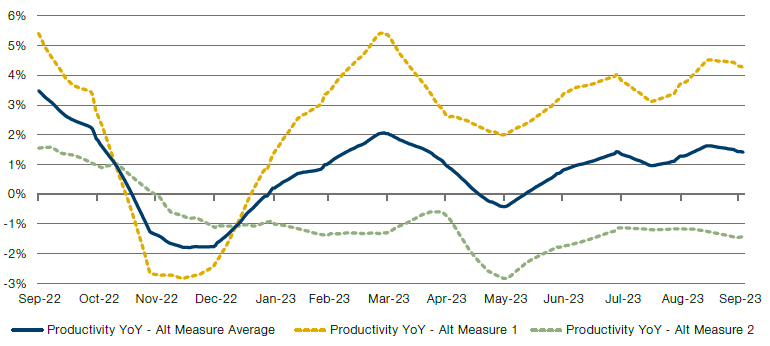
Source: : Bloomberg and Man Group calculations. Alternative measure 1 takes average hours worked per week and total employees from the BLS monthly jobs report. It then estimates current real GDP using the Atlanta Fed’s NowCast model to calculate an implied YoY productivity growth. Alternative measure 2 takes the number of employees in the Russell 3000 and the Street’s 12-month forward sales estimate for the same. Assuming hours worked stays constant we can therefore calculate implied growth in sales per employee, a measure of productivity. We then deflate this by headline CPI. Both measures are smoothed on a 30-day trailing basis.
At the start of 2023 the bears missed three things. First, how bearish everyone else was and thus the lack of a marginal seller. Secondly, the power of the disinflation tailwind. And thirdly, the AI hype cycle. To me it seems clear that the first two legs of this stool have been kicked out. Sentiment has improved markedly, while inflation, though unlikely to rise radically from here in my view, probably doesn’t have that much further to fall. To me the AI productivity revolution piece is now starting to look wobbly.
Most people – myself included – are in broad agreement that over the long term this technology has scope to deliver meaningful productivity gains. But sign me up for the old adage – which I was recently told is Amara’s Law, whoever she might be – that says that people tend to overreact to innovation in the short term, and underreact in the long. The relevant question is less what will AI do in 10 years, and more, what will it do in 12 months, and will it be enough to counteract the fast closing jaws of monetary tightening? Godzilla versus Kong with the fate of the S&P in the middle. Figure 2 can be monitored on a daily basis so… we’ll know it when we see it, but currently, we’re not. This is one of the reasons I continue to be bearish equity risk on a 12-month view.
But far be it from me to leave readers in this slough of despond. So, as a conclusion, let’s do a bit of the armchairs-and-cigars long term pontificating. Consider Figure 3, which uses Bank of England data and a few statistical leaps (again, see the footnote if that’s you) to chart annual UK productivity growth over 750 odd years. The point of this, apart from my enjoyment of a long-term chart, is to give some sense of what an historic productivity leap looks like. On a 10-year view 3% is good. Think the opening up of the New World or peak British Empire / Industrial Revolution. 4% is really good: the printing press or the post-WW2 rise of lean manufacturing. 5% is epic and has only been hit once before, in the period of deforestation and rise of arable farming that came through the 14th century. 5% compounded over 10 years would be a 63% productivity increase. See you on the other side.
Figure 3. UK productivity growth over the (very) long term
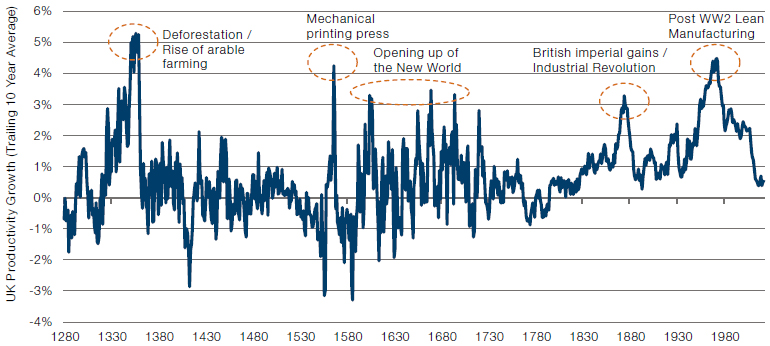
Source: Bank of England’s Millenium of Macroeconomic Data. Note that prior to 1760 we make the (perhaps overly) simplifying assumption that employment as % of population stays constant at 71%, the 1760-1780 average.
You are now leaving Man Group’s website
You are leaving Man Group’s website and entering a third-party website that is not controlled, maintained, or monitored by Man Group. Man Group is not responsible for the content or availability of the third-party website. By leaving Man Group’s website, you will be subject to the third-party website’s terms, policies and/or notices, including those related to privacy and security, as applicable.