About where it is now, possibly a touch higher. Those who are willing to take us at our word can stop reading and head to the pub. For those who want some extra zingers for your dinner parties, read on. First, I should say that this edition of The Road Ahead is co-authored with my venerable colleague Yash Panjabi. A sharp fellow, as will become apparent from the improvement in my usual standards of penmanship.
And secondly, we should pause for breath and rehearse some context. Because it’s been quite a ride for bonds. US Treasuries (UST)1 fell 9% in the three months through to the end of October 2022, as inflation concerns lingered. They then rose 8% in the five months through to April 2023, as the lingering stopped and some banks exploded, causing classic risk-off price action. The next six months saw a 7% decline as UST supply glut became the anxiety du jour. Then the whiplash continued with an 8% rise through to today, after Jay said it was all going to be okay.
Our message is, PROBABLY, 2024 will be a quieter year. Even a modest recession shouldn’t cause a dramatic decline in UST10 yields. For the descent to be more precipitous would require a bad recession. Equally, a significant move higher would require a resurgence in inflation. While both scenarios are underpriced by a currently complacent market, the base case (for us) is a mild downturn. In that eventuality, long duration likely returns its carry and not much else besides. What follows are two ways to think about where the US 10-year yield should be, interspersed with a short detour to consider the extent to which surprise rate moves impact yields.
Method #1: The Precedent of Historic Fed Easing Cycles
Figure 1 shows cash rates (top panel) and the 10Y-cash yield curve (bottom) for the last 80 years, overlaid with Federal Reserve (Fed) tightening cycles (shaded yellow). The numbers on the charts denote the change in each through the 12 months following the last hike. Eagle-eyed regular readers will notice that this material is recycled from the last note, but it is worth repeating
Figure 1. US Cash Rates and the Yield Curve Overlaid with Fed Tightening Cycles
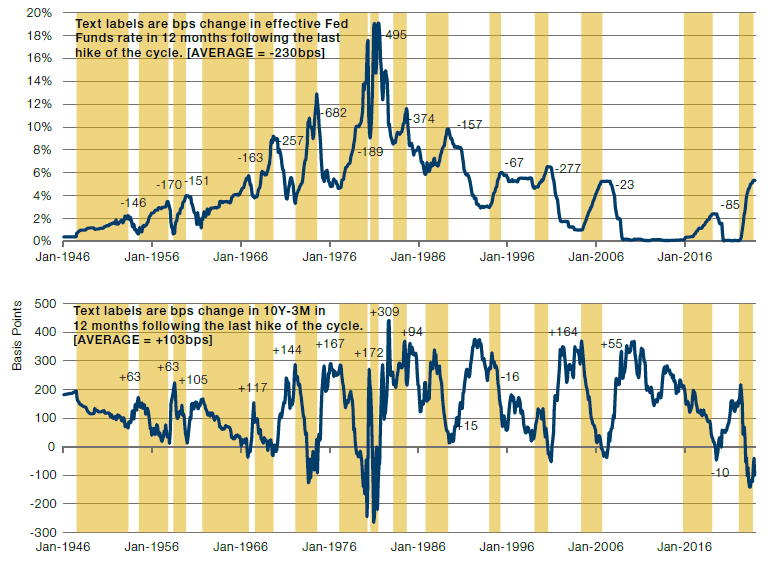
Source: Bloomberg, GFD, Man Group calculations. Hiking cycles shaded in yellow, defined optically.
12 months from the final Fed hike in the current cycle would be July of this year. By that point the market thinks the Fed will have cut three times. Let’s take this pricing as gospel for the time being. This would imply -75bps in the 12 months following the final rise. That would look normal (perhaps slightly on the light side) if it was added to the top panel of Figure 1.
What would be more unusual would be if such a tightening occurred without a notable steepening of the curve. When the Fed finished hiking in July 2023, the 10Y-3M curve was -116bps. Today it’s not much different. So, assuming the Fed cuts in line with the market, and we get the 103bps average steepening indicated in the bottom panel of Figure 1, that would put the UST10 yield around 4.3%. As we said at the start, a bit higher.
The Short Detour: The Link Between Surprise Rate Moves and Changes in UST10 is Inexact
This does not follow the flow of the narrative, but it’s an important point nonetheless. Beware the man who tells you that long end yields follow surprise short rate moves. The link is curiously inexact. This is pertinent because, though we were earlier taking the market’s expectations as gospel, they’re probably not. If we don’t have a recession, or even if we do but it’s a mild one, the expectation that the Fed will cut six times this year looks to be on the high side. Will they really cut in the September meeting knowing a certain someone might question their independence with the election looming? Speaking of which, will there not be a temptation for the FOMC to sit on their hands in the November meeting, which is just two days after the poll? Perhaps better to see how the dust settles. Anyway, you get the point, there’s an easily imagined pathway where the Fed is having to carry out a cut at every single meeting, assuming they stick to 25bps increments, which seems likely in a non-extreme scenario.
All this might make you quite bearish duration, but the recent past says it’s not so simple. We illustrate this in Figure 2. The light yellow diamonds on the right hand vertical axis show, at the start of each calendar year, the number of rate moves the derivatives market was expecting. This is compared with the darker yellow triangles which denote what actually happened. On the left-hand axis, we show the difference between the two in basis points as the navy blue bars, being in effect the surprise move in rates. In light blue we show the change in the UST10 yield over the same time period.
Figure 2. US Calendar Year Surprise Rate Hikes versus Change in UST10 Yield
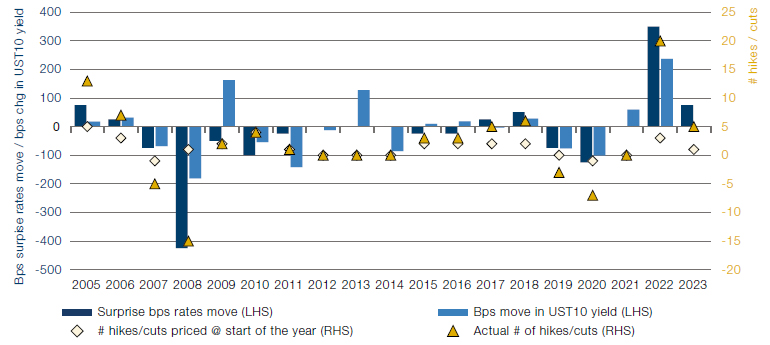
Source: Bloomberg, as at 31 December 2023.
It’s a relationship, but not one without noise. 2023 was a good example. At the start of the year the market was pricing in one hike. It got four. So 75bps of surprise hikes. But the 10-year yield was up… almost exactly zero. Okay, there were intervening pyrotechnics. In 2022 there were 350bps of surprise hikes but UST10 only rose 236. And so on.
It’s a basic observation but one that bears reiterating. Bond yields move, not because rate expectations are disappointed or surpassed, but because those perceptions of the future evolve.
Method #2: Disaggregating the UST10 Yield into Component Parts
As I have elaborated in previous notes (see https://www.man.com/maninstitute/road-ahead-five-reasons-to-buy-bonds), One can think about the 10-year yield being comprised of trend real growth, long run inflation expectations and the term premium. We have trend real growth for the US at 1.8%2, and inflation at 2.4%. We show the latter and its components in Figure 3. Hold the phone, we’ll come back to this in the conclusion.
Figure 3. US Long Run Inflation Estimates
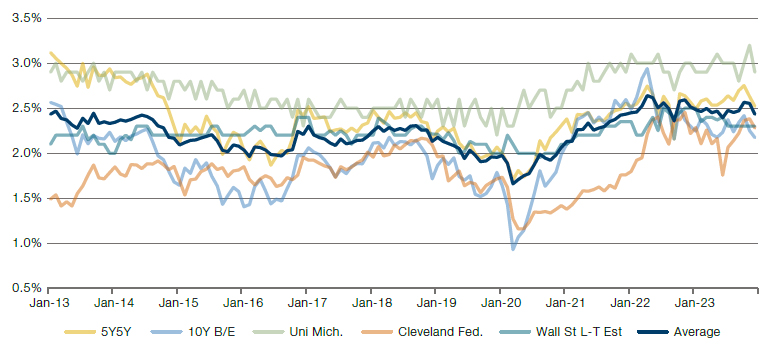
Source: Bloomberg, University of Michigan, Cleveland Fed, as at 31 December 2023.
1.8% trend real growth is reasonable to us, at least until we get some proven use cases of the promised AI productivity revolution. 2.4% long-term inflation, broadly fair, with one important caveat which we’ll come back to. Run with us for now. This gets us to 4.2%. So what’s the term premium? According to Tobias Adrian, Richard Crump and Emanuel Moench, it’s -17bps. According to Don Kim and Jonathan Wright, it’s -15bps. Now far be it for us to disagree with such luminaries of quantitative finance… but… how else to put it, we think those numbers are rubbish.
What is the term premium? No doubt the deep econometricians have an overworked formula somewhere. Here’s something simple: that which is left over once trend growth and expected inflation have been accounted for. In other words, a catchall for all the other uncertainty that time brings. Perhaps USDs stop being accepted in certain geographies. Perhaps the Fed decides to do yield curve control. Perhaps asset and liability management (ALM) frameworks become more important. Or less. And so on. Maybe these risks are very unlikely. Maybe you shouldn’t be paid (much) for taking them on, but should you pay to take them? We’d say no.
And this story’s got further to run. Because for the last decade the term premium has been utterly ignored, but such ignorance is just starting to dissipate. Baby’s deep in the corner, but Patrick Swayze’s about to saunter over. Consider Figure 4 as an illustration of the waning of this nonchalance. The charts show volatility and drawdown for the Austria century bond and Bitcoin (a perceived high-risk asset). Point being, they used to be very different, but now they’re the same.
Figure 4. Two Measures of Risk for the Austria Century Bond and Bitcoin
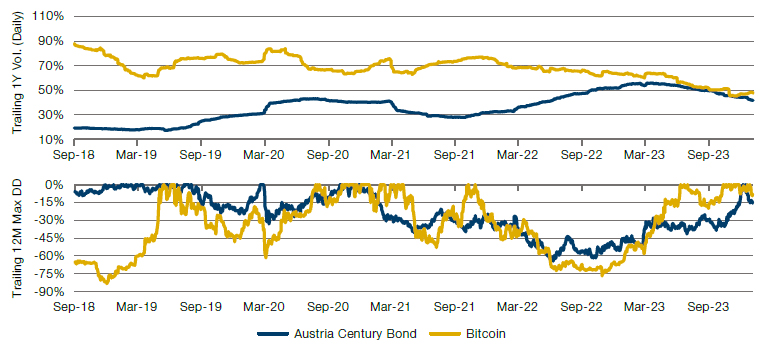
Source: Bloomberg, Man Group, as at 22 January 2024
Indeed, when the second of the two century bonds was issued in June 2020, it garnered a yield of just 0.9%. Even the most ardent Eurosceptic would struggle to argue for a nominal growth rate much below 1.5% over that kind of look-forward. Which would have put the term premium at -60bps. Today that same piece of paper is trading at 2.3%.3 So a term premium of +80bps on the same assumption. Back to the 10-year term premium, we’d take a punt for +10bps, with risks higher. That would take us to 4.3% base case on UST10, on the growth and inflation expectations already discussed.
A Word in Conclusion: Upside Tail Risk = BAD Recession, Downside = Inflation
The 10-year yield could drift 20-30 basis points higher through the year. With duration of eight and a yield of four, that gives you a total return of about 2% nominal.
So, in conclusion, we will briefly discuss some parameters on the upside and downside risks for 2024.
The upside case is a conventional recession. In this eventuality, the Fed would carry out a whole lot more than the six cuts the market is expecting for calendar year 2024. To give some context, in March 2020 they made six cuts in two weeks, and from a starting point 375bps lower. In a bad recession it is not inconceivable that we see double the number of cuts currently priced.
The downside case is the return of inflation. Figure 3 shows that, while long-run inflation expectations have moved up significantly from their Covid lows, they are now not wildly different to where they were before the pandemic. Call it 2.5% plays 2.3%. I went to Morgan Stanley’s Global Insights Day the other week. One of the audience polling questions was: “US core CPI is currently 3.1%, where do you think it will be at the end of 2024?”. 90% answered below 3%. In a room of around 250, not a single person thought it would be above 4%. If this heavy consensus is upset – for the second time this decade – then the long-term inflation expectation could take a proper step higher, one measured not in basis but percentage points.
1. As proxied by the Bloomberg Barclays US Treasury Aggregate Index. The index provides a measure of the performance of the US dollar denominated investment grade bond market, which includes investment grade government bonds, investment grade corporate bonds, mortgage pass through securities, commercial mortgage-backed securities and asset backed securities that are publicly for sale in the US.
2. We take the average of the Laubach-Williams R*, the L-W trend growth estimate, the Richmond Fed R* estimate and the long-term GDP growth estimate from the Street.
3. As a by-the-by, that puts the compound annual growth rate (CAGR) on the ‘trade’ for the Austrian Treasury at 24%. Those guys should start a macro hedge fund.
You are now leaving Man Group’s website
You are leaving Man Group’s website and entering a third-party website that is not controlled, maintained, or monitored by Man Group. Man Group is not responsible for the content or availability of the third-party website. By leaving Man Group’s website, you will be subject to the third-party website’s terms, policies and/or notices, including those related to privacy and security, as applicable.