Key takeaways:
- Over the very long term, equities are hard to beat in terms of native (that is, unlevered) returns. But stock performance, even over extended periods, can vary significantly. And if you are using leverage, the import of asset-class diversification is also levered
- Regional diversification within equities is one way to protect against sector rotation, the risk of which seems elevated given Technology’s strong run in recent years
- While the rewards of timing the stock market well are potentially lifechanging, the prospective costs of doing it badly are also elevated. All things in moderation, including moderation
Source: Bloomberg, Man Group calculations, as of September 2024, unless otherwise stated.
A flaw with the traditional active versus passive debate was always the decisions you still had to make. Did you buy a bond tracker or an equity tracker? In what proportions? Which sub-segments? And so on.More recently, an attractive solution has been mooted. Buy the S&P 500 Index. Hold it. Forget it. Here’s a meme which tickled (with profuse apologies to whoever first created it – I can’t find the source):

Reproduced from X.
Here are three questions which capture the thrust. (1) Should you bother owning anything other than stocks? (2) Should you bother owning anything other than US stocks? (3) Should you bother trying to time stocks? Faced with these, there is the temptation to channel Maggie Thatcher responding to Jacques Delors: “No, No, No!” But I’m on the other side. Here’s why.
(1) Should you bother owning anything but stocks?
Yes
But case for the prosecution first. Over the very long term stocks have returned about 10% per annum. By my reckoning, there are only two major asset classes which have done more, Trend on 11%, and Private Equity on 14%. And both have disclaimers attached. Not least the wide dispersion between naïve and sophisticated actors, and the difficulty of judging between the two. Gold’s long-term compound annual growth rate (CAGR) is around 8%. USD Credit is 7%. 10-year US Treasuries 5%. USD cash 3%. In short, in terms of native (that is unlevered) returns, not much can lay a glove on stocks.
Here’s a couple of lines of defence that, personally, I find persuasive. First, when I talk about ‘very long term’ I’m running numbers back 100 years, give or take. At some point you’ve claimed to be a long-term investor. But, be honest, are you really? Some grave news: in 100 years, you will be dead. Can you even wait 10 years? Looking back 10 years from December 1937, the US stock market was down 40% in nominal price terms. At the start of September 1946 it was -2%. In August 1982 it was -7%. As recently as August 2011 it was -5%. Your lived experience, even over long time periods, of how stocks behave can be very different from the +180% return over the last 10 years you find yourself looking back on today.
Moreover, in some of the worst years for stocks, I’d surmise your time horizon wasn’t 10 years. It may not have even been 10 months. And that pain was such that you were likely wildly grateful for some asset-class diversification. Figure 1 shows the 26 years post-1800 when stocks were down 10% or more, alongside the return of a 60/40 portfolio in those same years. On average the latter was half the drawdown of the former. Over this time 100% equity gave you an annualised return of +8.7%. 60/40 was +7.5%. So there is a performance drag. But as discussed in a prior note, 90% of the time, the best days for risk assets come within 12 months of the worst times.1 It is worth trying to negate the potential of you doing something stupid, when your practical time horizon has been dramatically shortened by pain. Volatility has real world effects, in other words.
Problems loading this infographic? - Please click here
Second line of defence. IF you can use leverage, logically you should buy the highest Sharpe portfolio and scale to your required return. And 100% equity is not the highest Sharpe portfolio. I’m fully aware that’s not as simple as it sounds. Mandate restrictions, as well as operational concerns around cash efficiency in a higher rate world, set limits on the extent to which investors can pursue this. If that’s you, skip to next section. Otherwise observe Figure 2, which shows a fitted distribution of monthly returns over the past 100 years to two portfolios. One 100% equity, one 30% equity, 60% bonds, 60% alternatives. In other words, the latter is 1.5x levered.
While the diversified and levered portfolio has a slightly higher return in totality, it has less kurtosis in its distribution2. To you and me, it has fewer extreme outcomes. Thus, both its volatility and drawdown are around half that of pure stocks. The note of caution is that if you are levered at the portfolio level, asset class diversification is vital. And more so than just diversifying equities with bonds, per Figure 1. Indeed, you can see on that chart that 2022 is an outlier in that 60/40 drawdown was almost the same as the equity trough. Negative stock-bond correlation is not a given, as we have repeatedly stressed in these notes. So take this as a reminder that leverage and risk are not synonymous. But also, if you are using leverage, the importance of true asset class diversification, is also levered.
Figure 2. Probability density function on monthly returns (1927 to present))
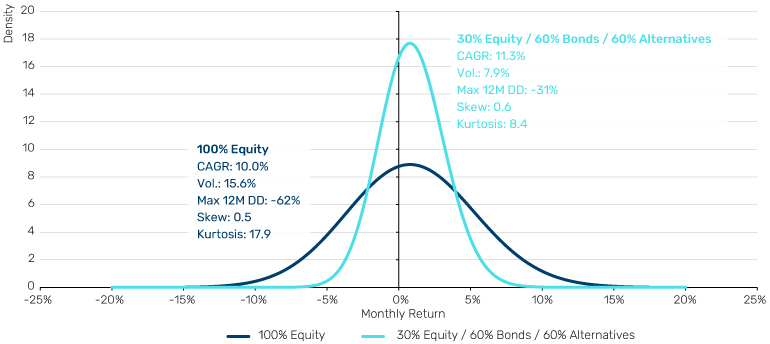
Past performance is not indicative of future results. Source: Equity is Professor Shiller’s US equity series. Bond is represented by the UST10 and is taken from GFD. Alternatives represent a portfolio of equal capital weights to commodities, trend and equity long/short. Commodities are proxied with an equal weight portfolio of all futures contracts as they appear through history. Pre-1946 this is based off work done by AQR and post that date we use futures contracts from the Man AHL database. Trend is a long-term portfolio constructed by Many AHL which aims to replicate the exposures of the BTOP50 index at 15% volatility, covering commodities, FX, equities and bonds. Equity long/short is volatility scaled equal weight portfolio across the Fama-French SMB, HML and Mom. factors, as well as the AQR BAB and QMJ factors.
(2) Should you bother owning anything but US stocks?
Yes
As discussed in my last note, over the very long run, even taking into account currency returns, a US and equal weight global equity portfolio have returned almost exactly the same per annum, at 10%.3Moreover, they have done so with similar levels of risk. However, Figure 3 shows the shift in calendar year differentials before and after the Global Financial Crisis. Before, it was 50/50 on whether you were better off in global or US equities. After it’s been more than 80/20 in favour of the latter. And worth saying that this kind of persistence of outperformance is not like flipping a coin whereby you might have had nine heads in a row, but the odds of another on your tenth toss are still 50/50. Imbalances build up in these relative stock returns, and in my view the risk of them tipping over is elevated.
Figure 3. World versus US stocks calendar year performance differential
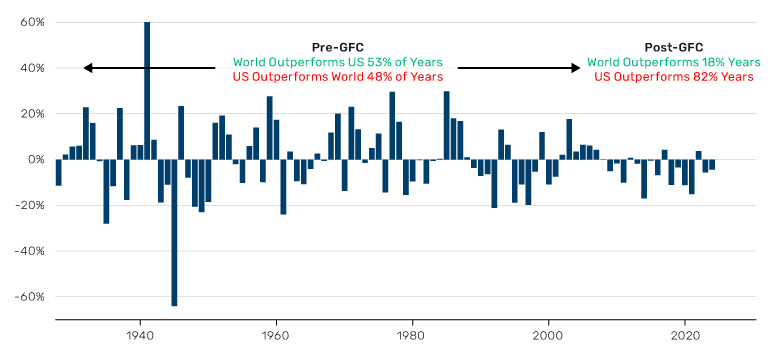
Past performance is not indicative of future results. Date range: December 1927 – July 2024. Source: Bloomberg, Man Group Database. Prior to October 1959 we use French equities as a proxy for EZ and Germany after that, however we use the Deutschemark as the FX for the entire series until introduction of the euro.
The US relative to other regions is a big sector bet on Tech, itself a segment which has run persistent outperformance in recent years. It therefore trades at or near record valuation premiums compared with other geographies. Figure 4 shows the US minus the UK multiple as an example. The former is 40% Tech and Communication Services and 4% Energy. The UK has a tenth of the Tech weight and triple the Energy allocation.
Looking at all years back to 1999, it is true that Tech tops the GICS league table more times than any other sector (seven). But it regularly foots it as well. Indeed it has been in the bottom three on nine occasions, also a record. Meanwhile, Energy is second place in terms of trophies won (six). Both Tech and Energy have high levels of implicit leverage. Energy via operational gearing from a weighting towards fixed costs. And Tech via the long duration implicit in product which is both a complex and far horizon. There is at least some chance that AI follows Amara’s Law. And then you’d expect the gap in Figure 4 to close. Possibly quite rapidly. There’s already been a shot across the bows in the form of 2022. While US stocks fell 20%, the UK rose 5%. Regional diversification within equities is one way to protect against sector rotation, the risk of which is, in my view, heightened.
Figure 4. US minus UK forward price-to-earnings multiple
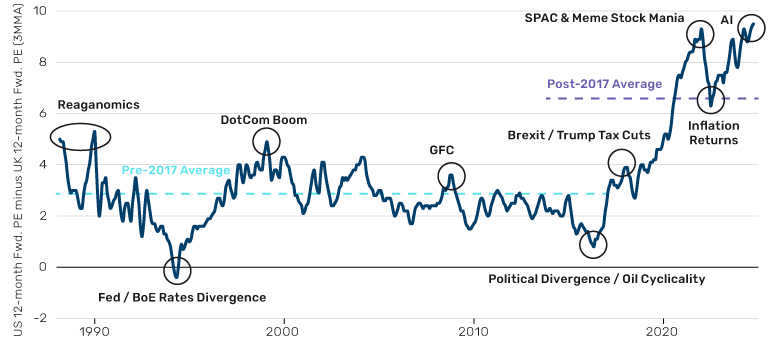
Date range: March 1988 – September 2024. Source: Bloomberg, IBES, Man Group calculations. We use S&P as a proxy for US equities and MSCI UK as a proxy for UK equities.
(3) Should you bother trying to time stocks?
Yes. But…
Most hesitant on this one. However, if you’re with me on the first two questions, you now have a portfolio with some other assets in it. Should you flex that ratio based on market conditions? The hesitation comes from Figure 5. Do you really want to stand in the way of that? Bull markets are 80% of history and are often very big. Meanwhile, bear markets regularly come as the handmaiden of a Black Swan, as indicated by the annotations in brackets, rather than the gradual deterioration in fundamentals that you find in the textbook. Which is harder to predict. That being said, is it the Black Swan which leads to the deterioration in fundamentals, or the deterioration in fundamentals which provokes the Black Swan? It’s an open question, in my view.
But the temptation remains. And that’s because the potential rewards are very large. US$100 invested in the US stock market in July 1926 is worth US$1.1 million today, if you had bought-and-held. However, if you’d ninjaed your way out of the 65 days through that period where the market was down 5% or more, you’d be sitting on US$112 million. Never work again kind of money. The knife cuts both ways. If you’d gone wrong and instead had been out for the 60 days where stocks were up 5% or more, your ‘bounty’ would be US$19 thousand. That’s ‘k’ not ‘m’. So while the potential rewards for good market timing are high, the potential costs for doing it badly are also elevated.
Figure 5. S&P Bull and Bear markets over last 100 years (numbers are length of time (yrs) / nominal CAGR)
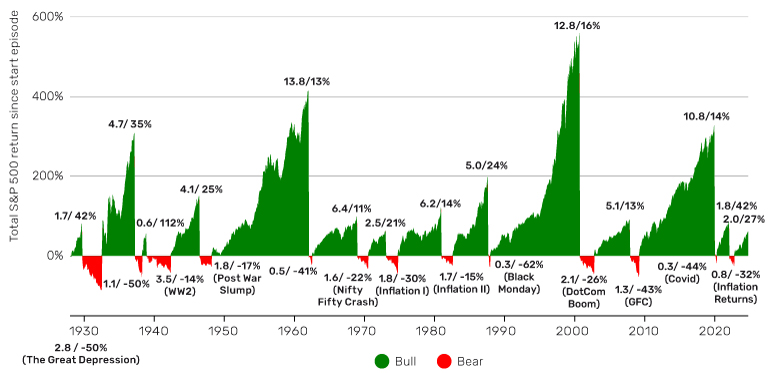
Date range: December 1927 – September 2024. Source: Bloomberg with market regimes defined by Man Group.
Where I come down is the old adage of ‘all things in moderation, including moderation’. Most of the time, buy, hold, forget. At extremes, do something. What do I mean by extremes? There’s no silver bullet, and if there was, I wouldn’t tell you. But here are two things that help a bit. First, think about the market regimes where stocks have historically performed poorly. I discussed this at length in a Previous note. There are three regime states where you want to be out of equities. High and rising inflation, recession, bear steepening. These are shown with summary statistics in Figure 6. This still leaves you with the problem of predicting regime change, which is no mean feat, but in my view it’s more intelligible than trying to think about drawdowns in isolation.
Figure 6. Real S&P total returns overlaid with inflation, recession and bear steepening regimes
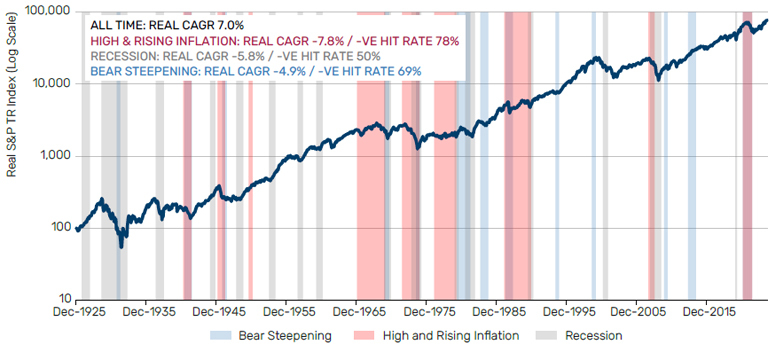
Date range: December 1925 – September 2024. Source: Bloomberg overlaid with Man Group defined regimes, with the exception of Recession where we use the NBER cycles. High and Rising Inflation is where US HL CPI YoY moves through 2%, then 5%, then peaks. Bear Steepening defined as where the gradient of the curve is rising over the last 12 months, and where the mid- point of the curve is also increasing.
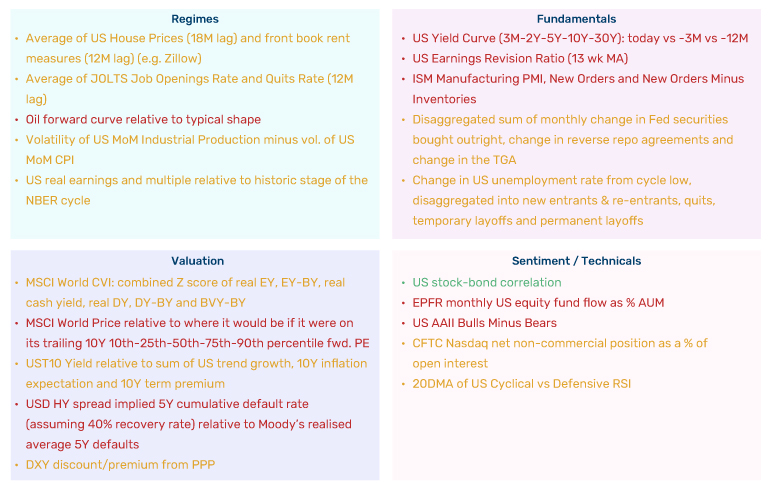
And secondly, have a dashboard of financial data which is varied, discrete and consistent. Varied in that you’re not just looking at valuation metrics, or positioning data, or growth indicators, but seeking to cover the full range of lenses that practitioners proscribe. Discrete in that you’re limiting their number. In a world where anyone with a Bloomberg terminal, or even an internet connection, has access to more data than they could usefully do anything with, filtration has become a key competency for investors. Otherwise you risk going mad, lost in the data forest. And consistent, as an antidote to getting led astray by every new broker email with that shiny new Sharpe 2 indicator. Of course, everything loses efficacy at some point, but in the meanwhile, look at the same things, and look at them regularly.
Figure 7 is my attempt at a ‘desert island indicators’. I’ve coloured them qualitatively: red for bad time for stocks, amber medium, green good. Bad extremes are lots of red, good extremes are lots of green. Those are the times for market timing, under and overweight respectively. Right now I’d say we’re not quite there, but not lightyears off the former. Itchy trigger fingers.
Figure 7. An example financial market data framework
Source: Prepared by author.
In conclusion: An attempt at three answers
Should you bother owning anything other than stocks? You may like to think you’re a longterm investor, but most people’s horizons will become dramatically shortened in times of equity market stress. And in those times, you will be acutely grateful for any relief asset class diversification can bring. There’s a good chance it will stop you doing something stupid, even if, in theory and over grand history, it is a drag on returns. And this is particularly true if you’re using leverage.
Should you bother owning anything other than US stocks? If you are 100% US within your equity allocation you are taking a massive sector bet. You are full speed ahead on the Tech-will-save-the-world narrative and you’re not looking back. Forget hard or soft landing for the economy, the current US valuation premium is pricing in an immaculate landing for the AI near-term productivity miracle story.
Should you bother trying to time stocks? I’m most hesitant about market timing. ‘Set and forget’ has a wisdom to it. But I’m of the view that there can be times where extremes are so apparent that the old trope of ‘time in the market, not timing the market’ is lazy. And this note is, after all, against apathy.
1. See: https://www.man.com/maninstitute/road-ahead-on-pain
2. By-the-by, I chose this ratio somewhat flippantly, as the asset allocation most likely to bequeath your sprog a million bucks. See:https://www.man.com/maninstitute/road-ahead-a-million-dollars
3. See: https://www.man.com/maninstitute/road-ahead-double-double-toil-trouble

You are now leaving Man Group’s website
You are leaving Man Group’s website and entering a third-party website that is not controlled, maintained, or monitored by Man Group. Man Group is not responsible for the content or availability of the third-party website. By leaving Man Group’s website, you will be subject to the third-party website’s terms, policies and/or notices, including those related to privacy and security, as applicable.