Please note that the opinions discussed below are those of the individual authors and do not reflect a Man Group house view. All market data referenced below sourced from Bloomberg unless otherwise specified.
Preparing for Pain, Ahead of Time
What have been the most painful experiences of your life? In medicine, pain scales are used to help patients express the magnitude of their discomfort. Scrolling through Google I find an example which runs from one (‘Barely noticeable. Something’s not quite right’), through five (‘You are starting to limp, wince, and are finding it difficult to suppress outward signs of pain’), up to 10 (‘Active trauma. You’re screaming incoherently and strangers have called 911 on your behalf’). And then there is emotional pain. Fewer scales for that. Easier to hide behind the stiff upper. But perhaps one might be your team losing, six a messy divorce and 10 a close friend or family member dying before their time.
Which rating would map to your most painful investment experiences? The month when that portfolio risk you had no idea about blows up. Or when that long-cherished view is revealed to be completely wrong. Or unexpectedly right, but you capitulated last week. And your investors are furious, your numbers are emblazoned on Morningstar, you hear your name in every whispered conversation.
Forewarned is forearmed. Reflecting ahead of time on how we might respond to pain can improve the investment decisions we make under it. It seems probable that the average person today feels fewer objective pain stimuli than they did 100 years ago, where medical operations, raising families or keeping your job were all more precarious than they are today. For many reading this in 2024, it may be that the low points of a career managing money are up there with the most painful experiences of their lives (as absurd as our Victorian forbears would have found this). We are not practiced at enduring pain. Some will say that practice trumps reflection but, to save some strange looks, I’ll settle for the latter, and suggest you do likewise. Here are three.
#1: Your Memory of Prior Pain is Likely Deceptive. It Was Probably Worse
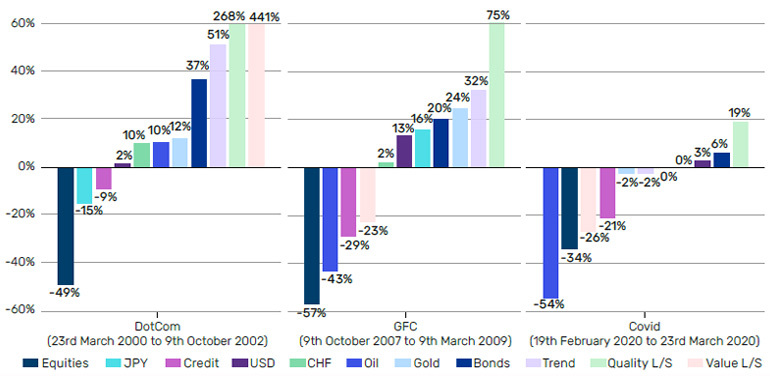
Figure 1: Returns to Various Assets Through the Last Three Major Equity Sell-Offs1
Most people, understandably, don’t like to dwell on episodes of pain. As an antidote to this we tend to sanitise our memories with simplified templates of how a particular event played out. Neuroscientists break our memory into two distinct types: semantic and episodic. Semantic memory has a framework of knowledge around it. It is cold and rational and contains meaning. This is how you remember the Black-Scholes formula and how to use it. Then there’s episodic memory, which is the memory of events. Episodic memories are generally recalled as what the academic literature calls “flashbulb” moments, where broader spans of time are condensed into momentary images, the instant as a simulacrum for the lived experience.
In an interesting article in my bedtime reading of choice, The Journal of Pain: Official Journal of the American Pain Society, Rohini Terry and her colleagues at the University of Stirling explored what is called the phenomenology of pain – whether we remember pain itself, or merely are aware as a semantic fact that the pain took place. Their findings are fascinating – the answer seems to have to do with the type of pain experienced and its duration. The key message, though, seems to be that we have an inbuilt (and potentially evolutionarily useful – just ask a woman who has given birth) ability to “forget” the intensity of pain, remembering it only in factual terms.
There’s this playbook we have in our heads of what the Global Financial Crisis (GFC) was like, or what Covid was like, but in so doing we lose sight of what it felt like, trading through it in real time. What happens if we try to get closer to the lived experience of that pain, to build up a phenomenology of financial loss as it is felt by those at the coal face?
In Figure 1, I show returns to various assets through the last three market heart attack moments: the DotCom bust, the GFC and the initial Covid sell-off. These were the last three times the S&P fell by a third or more.
Here's what a generic cross-asset strategist might tell you to do in a market stress event. Do not own: equities, credit, oil, value. Do own: Treasuries, gold, trend, quality, USD, JPY, CHF. Squint at Figure 1 and you can just about make that case. But it is messy. Quality, bonds and USD are the only ones consistently going in the direction they ‘should’ be going in. Moreover, the magnitude of the equity drawdown relative to the stuff that works, combined with the proportions in which one would realistically hold them, mean that some pain is inevitable. If a normal asset allocation is something like 40% equities, 40% bonds (which will include some credit), 20% alternatives, it is hard to come up with a plausible scenario where you are not double-digit negative at the portfolio level. To be fair, jamming the entire alternatives allocation into Value L/S through the DotCom bust would have been tidy. But if you managed that then I doubt you’re reading this.
Even when memory of pain is accurate, it is often limited by lookback. The median Man Group employee is 34. For him or her I needn’t have bothered with the first two panels of Figure 1, because the third is all they’ve got. But let’s say you’re a greyer head. Or if not, let’s say you’ve respected your elders enough to seek their counsel, and thus have the whole memory of Figure 1. After Covid you might think, ‘I’ve seen this tape before, bonds and quality L/S is what I need for when this comes round again.’ But then 2022 happened. Between 3 January and 12 October the S&P fell 25%. The Bloomberg Barclays 7-10 Yr Treasury TR Index was down 15%. Morgan Stanley US Quality L/S fell 9%.
Figure 2: S&P Performance through Specific Days
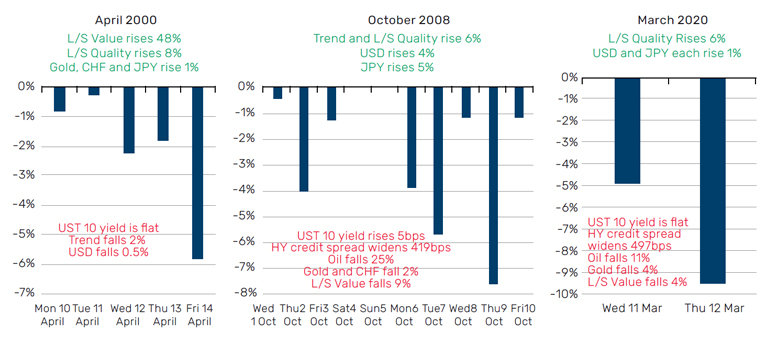
Thus, we do well to understand that these crisis times will inevitably be painful to some degree, and often in ways we do not expect. We also do well to reflect on how these events would have felt in the moment. In Figure 2, I show some specific days within each episode. The day-by-day reality in these events would have felt very different to how they look in hindsight, in totality, and in a two-dimensional bar chart like Figure 1. For instance, and per the middle panel in Figure 2, starting on Wednesday 1 October, there were eight days of consecutive equity declines, with the S&P being down 23% in total. In that time Treasury yields ROSE, while gold and the Swiss franc fell. Oh, and the Financial Times headlines read like this:
“We are watching the disintegration of the financial system” (1 October)
“World turmoil: Worst falls since Black Monday 1987…Footsie’s biggest points slide ever” (7 October)
“UK banks to be part-nationalised” (8 October)
“Wall St plunges in trading frenzy” (10 October)
“Scramble to avoid a global collapse” (13 October)
Ever mindful of the varied circumstances of its readership, the front pages also included “How To Spend It: Escape the turmoil in the Arizona Desert” (10 October). I imagine it was a niche subset for whom exotic holiday planning was front of mind, however.
So, note well. When you remember past events of market pain, you’re probably remembering them as more predictable than they were. You’re probably remembering the risk-off hedges as more effective than they were. You’re probably remembering the event holistically, rather than reliving how your portfolio travelled through it, day by day. Own the fact that, no matter how well prepared, you are likely to experience more pain than you expect. As when the dentist hovers over saying you are about to feel some slight pressure. Don’t believe a word of it.
#2: Know the Power of Pain to Make You Do Stupid Things
The power of compounding is the eighth wonder of the world, so a wise man once said. But what gets lost in these ‘the S&P has never lost money in a 15-year period’ kind of adages is that, under pain, people forget them.
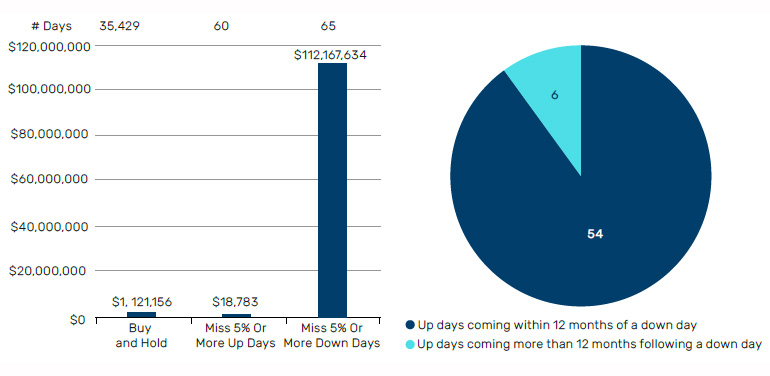
Figure 3 is an illustrative example of this. If your great grandpa had the foresight to put $100 into US stocks on your behalf in 1926, you’re a millionaire. If you had the same holding period but managed to ninja your way out of the 65 days when the market was down 5% or more, you’re worth a cool $112m. Miss out on the 60 best days, however, and your reality differs by non-figurative orders of magnitude.
Nothing particularly new here, although it’s a good advertisement for the power of effective risk overlays. But now turn your gaze to the right panel of Figure 3. This shows that of the 60 5% or more up days, 90% come within 12 months of a 5% or more down day. This shows how a drawdown can sting you twice. Once explicitly when you draw down. Then again implicitly, where coming out the other side, you’re hurting so much that you’ve become trigger shy. And this investment PTSD means you miss the ensuing rally.
Figure 3: (LEFT PANEL) Present Value of $100 Invested in US Stocks in July 1926 under Different Scenarios. (RIGHT PANEL) Timing Relation between the Best and the Worst Days for US Stocks2
This is not to say there is never wisdom in capitulating. ‘If you’re going to panic, panic early and panic hard’ is a well-worn market adage, and one which certainly has some credibility. But know that, when you’re under a lot of pain, you are probably at a greater risk of making a stupid decision than when you are not. And for MOST people, that probably involves seeking a haven in caution. Like the prisoner of war who can only repeat his name and number, pain can be the solvent of hope, imagination, vigour. Be ready for this. Resist it.
#3: There Are Different Types of Investment Pain. Know Which You Find Most Bearable
Speaking to a former emerging markets fund manager, asking for their most painful investment experience:
“I would say 2012 when the Russian government toyed with a change in the tax regime for natural gas extraction. Novatek - 5% position - went down 30% in one day. I was convinced that it did not make logical sense given the economic incentives Novatek required to invest in complex projects of strategic importance for the Russian state. I held on because I was "right", and then eventually capitulated after a week or so of torment. A few hours after I exited, the energy ministry came out with a clarification. Stock recovered. I don’t think I did.”
Experiences of investment pain can be very specific. If you are suffering in company, as you often are in the big pain episodes we’ve already discussed, then that can be a comfort. Of course, the big pain episodes have a habit of causing some pronounced rotations which are certainly going to whiplash those on the wrong side of them. Try Value L/S rising 48% in five days, per the left-hand panel of Figure 2. Investors need to understand under which circumstances they suffer most pain. Is it in terms of absolute underperformance, in terms of weakness relative to a benchmark, or in relation to a peer group?
Another distinction in terms of types of pain concerns the pathway of returns. This can be summarised in three questions:
- What hurts more, high volatility with proportionately low drawdown, or low volatility and high drawdown?
- If the former, do you prefer volatility to be high but predictable, or low but unpredictable?
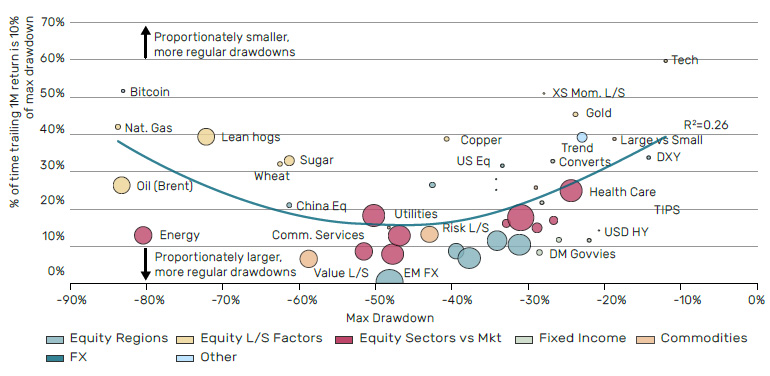
- If you prefer drawdown, do you prefer it to be short but steep or long but shallow?
From the top. Are you the sort of person who prefers the boat to be buffeted by small waves all the time, or a millpond hit by the occasional storm. Figure 4 shows the relationship between volatility and drawdown for a variety of assets over the last 10 years. I’ve grouped them by category and labelled the most notable.
Figure 4: Drawdown versus Volatility Over the Last 10 Years (Size of Bubble = Max Drawdown as Multiple of Volatility)3
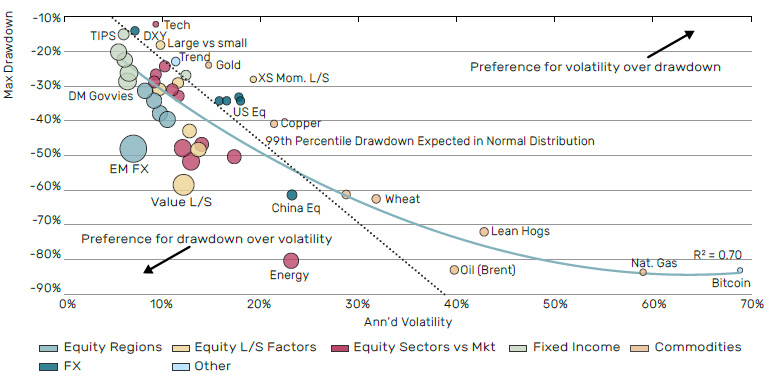
There is a relatively close relationship between volatility and drawdown, as illustrated by the r-squared at 70%. The relationship is not linear, however, and where volatility goes much above 30%, maximum drawdowns start to deviate from what we might expect from a normal distribution (as shown by the widening gap between the solid blue and black dashed lines), and indeed is lower than might be anticipated. Looking at this chart, to where do you gravitate? Toward Bitcoin or government bonds and you are relatively indifferent between drawdown and volatility. Toward copper, cross-sectional momentum, gold and tech, you prefer volatility to drawdown. Toward EM FX, Value, energy and oil, the reverse. Clearly, these are heuristics, but they give a useful start point for determining how we are likely to respond to particular formats of pain.
You get the idea. In the interests of brevity, I’ll leave you to your own devices for Figures 5 and 6 which illustrate, respectively, questions (2) and (3).
Figure 5: Volatility versus Vol of Vol (Size of Bubble = Vol of Vol as Multiple of Volatility)4
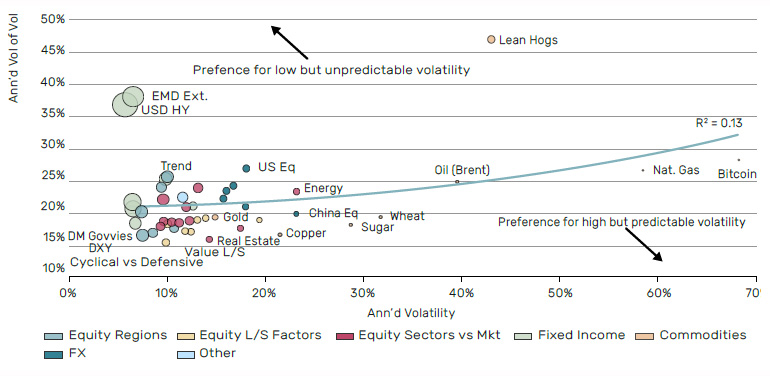
This is the ‘know thyself’ bit. You have been made uniquely, not just in terms of overall level of pain tolerance, but in terms of the types of pain you find bearable. There will be pragmatic as well as psychological reasons why you are biased in one direction. For instance, an insurer with short duration liabilities is going to be particularly averse to drawdowns because they risk crystallising trough losses. A risk-parity investor will prize predictability of volatility over level, given they are teeing off that to size their allocations. But on both a pragmatic and psychological level, knowing ahead of time which types of pain you find more or less painful, will make it easier to resist over- (or indeed under-) reaction, when you find yourself in its grip.
Figure 6: Persistence of Drawdown versus Max Drawdown (Size of Bubble = Length of Max Drawdown)5
In Conclusion, Strategies to Cope With Pain
This could be an entire note in itself, so I’ll be brief, and happy to continue the conversation in person, as ever. Here’s the five-point to-do list.
- Gird your loins. Pain will come in your investing career. Know that this is a natural part of the money-manager’s journey. Enduring it is part of the job.
- Keep an investing journal. Can be as simple as a few lines a couple of times a week. But should be specific to the markets and your portfolio, rather than part of something more general. What’s moving? What are the financial cognoscenti saying? Do you agree? What portfolio decisions are you agonising over? Are drawdown worries keeping you awake at night? And so on. Over time this will allow you to build up a phenomenological resource to prevent hindsight bias creeping into your memory of key risk events (as discussed in section 1). It will also give you greater self-knowledge around what specific market gyrations you find most painful, and how you made decisions when under pain.
- Keep investment constitutions. Both general – when I have a drawdown of x magnitude I do a, b and c – and specific – I’m putting on this trade because of this belief, which will be challenged if any of the following happen.
- Coaching. Ideally from someone who understands markets in broad brushstrokes, but who is not a participant. Someone you can talk through a particular portfolio decision with, and who will listen and ask questions to help you process the logic of that decision without being so deep in the weeds they end up talking their own book. A kind of Catholic confessional without the Hail Marys.
- Keep a diverse circle of fellow investor contacts (friends, even). This is not hand-waving diversity for diversity’s sake, rather the acknowledgement that different life experiences will have created different attitudes to pain, which can be learned from. I’ve already touched on the value an older investor has in being able to recount experiences forgotten by the median portfolio manager. It also seems likely that people from different socio-economic backgrounds, for example, will have experienced different types of pain. It hardly needs saying that everyone freaking out at the same time is not productive. If one can create an environment where different team members are experiencing pain at different times it seems reasonable to assume that there is some smoothing benefit attached to that.
Investing is relatively rare among professional services, in as much as your ‘progress’ is published to a lot of people, in real time. This makes the pain that comes with failure (whether temporary or permanent) that much more acute. That’s the cost. The quid pro quo is that it allows for more opportunity for character development. So don’t just rage against the pain. Approached correctly, it’s making you better.
1. Time periods defined as the peak to trough of the S&P 500 Index in each of the pertinent episodes. Equities are represented by the S&P 500 price return. Currencies are against the USD. The USD itself is the DXY cross currency average. Credit is Bloomberg Barclays USD Corporate High Yield Total Return Index. Bonds are Bloomberg Barclays 7-10 Yr Treasury Total Return Index. Gold and oil are returns to the near end futures contract and do not include the roll yield. Quality and value long-short (L/S) are Morgan Stanley’s L/S factor baskets. Trend is Société Générale Trend peer group.
2. US stocks represented by the Fama-French data. The two scenarios assume you make zero on the +/- 5% days.
3. All data from Bloomberg, last 10 years, daily periodicity. The blue trend line is the second order polynomial. All equity indices are MSCI. All L/S factor indices are Morgan Stanley based on US geography. Equity sectors are the US GICS sector as defined by S&P, relative to the MSCI US index. All fixed income indices are Bloomberg Barclays. All commodities are near end futures price return. All FX is against USD. Trend is the Société Générale Trend peer group.
4. All data and sources as per Figure 4.
5. All data and sources as per Figure 4. Length of max drawdown is calculated as the number of days between the high watermark and the trough, over the last 10 years.
Index definitions
Bloomberg Barclays USD Corporate High Yield Total Return Index
The Bloomberg US Corporate High Yield Bond Index measures the USD-denominated, high yield, fixed-rate corporate bond market. Securities are classified as high yield if the middle rating of Moody’s, Fitch and S&P is Ba1/BB+/BB+ or below. Bonds from issuers with an emerging markets country of risk, based on Bloomberg EM country definition, are excluded.
Bloomberg Barclays 7-10 Year Treasury Aggregate Bond Index
The Index measures the performance of the U.S. Government bond market and includes public obligations of the U.S. Treasury with a maturity of between seven and up to (but not including) ten years. Certain special issues, such as state and local government series bonds (SLGs), TIPS and STRIPS are excluded.
Bloomberg Commodity Equal-Weighted Sector TR Index
The Index is designed to be a highly liquid and diversified benchmark for commodity investments, providing equal-weighted broad-based exposure to commodities; no single commodity or sector dominates the Index.
MSCI USA Index
The MSCI USA Index is designed to measure the performance of the large and mid cap segments of the US market. With 609 constituents, the index covers approximately 85% of the free float-adjusted market capitalization in the US.
Société Générale Trend Index
This is an index of CTA funds that is equal weighted and calculates the daily rate of return for a pool of CTAs selected from the larger managers in the universe.
S&P 500 Index
The S&P 500 Index is a market-capitalisation-weighted index of 500 leading publicly traded companies in the US.
You are now leaving Man Group’s website
You are leaving Man Group’s website and entering a third-party website that is not controlled, maintained, or monitored by Man Group. Man Group is not responsible for the content or availability of the third-party website. By leaving Man Group’s website, you will be subject to the third-party website’s terms, policies and/or notices, including those related to privacy and security, as applicable.