Key takeaways:
- When the market becomes exuberant, it often becomes extremely so. Doublings (when the market’s value increases by 100%) tend to come in pairs, but there can be extended intervals between these pairs
- Perhaps counterintuitively, buying at rule-of-thumb bear market threshold (-20%) and selling when you’ve doubled your money realises less than buy-and-hold
- The names which have delivered the biggest returns in the cumulative space are largely old-economy companies which in part owe their slow-gotten gains to plugging away for a significant period
My wife’s grandmother died this year aged 100. Ida Beckett, this is your life (in US stock returns):
Figure 1: S&P price returns over last 100 years1
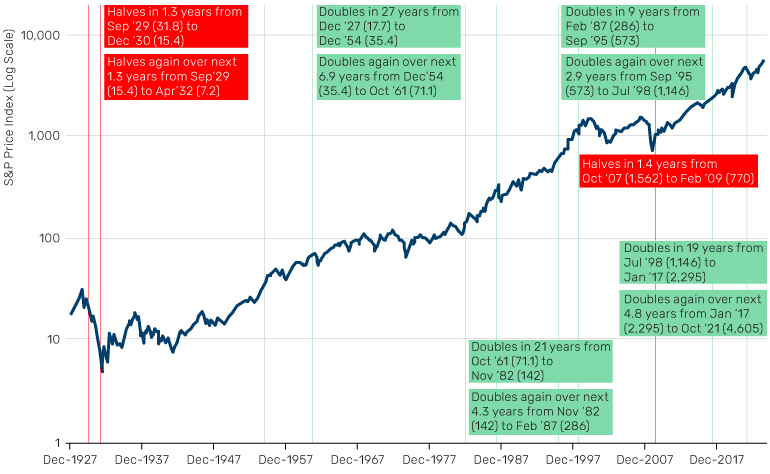
Source: Bloomberg, Man Group calculations.
Here’s a history in eight doublings. Or, if you prefer, four double doublings:
1. 1927 was a bad time to start investing. The market halved in the first 1.3 years, and then did the same in the next 1.3 years, as the Great Depression took hold. It would be 27 years before your initial investment doubled in price. But then things kicked on, as the ‘nifty fifty’ boom got going and Warren Buffett returned money to shareholders on the basis of irrational exuberance, it took just seven years for the next doubling
2. Then another fallow period, including the inevitable bursting of that bubble, along with the inflationary trials of the 1970s meant it took 21 years for the next 2x. By then, Ronald Reagan’s supply-side reform was in full swing, and we were back to the go-go years, with four years the interval for the next double
3. Black Monday in 1987 slowed things a bit, but broadly the market maintained a march higher, taking nine years for its next +100%. There then followed the DotCom crisis, probably the biggest bubble any of us will ever see, and the market took a record-quick three years to double again
4. The next wait was another long one, being interrupted by the third halving, with the S&P lashed, first by DotCom deflation, and then by actual deflation in the Global Financial Crisis (GFC). Two times the DotCom high came 19 years after that peak, as President Trump’s business friendly agenda buoyed stocks. And this double’s double took less than five years, as a face-ripping Covid stay-at-home Tech rally morphed into the SPAC- and meme-mania of 2021
Here are three reasons why this is important (and I’ll stop the numbering so this doesn’t become a shopping list). First, there are more doublings than there are halvings. So don’t let your cynicism or perceived cleverness get in the way of returns. As discussed in a previous note, equity bull markets describe an estimated 80% of history.2
Some will say there’s hindsight bias in choosing the world’s best performing stock market over the past 100 years. But Figure 2 shows that even if you use a more realistic equal weighting to the US, UK, Germany and Japan, the result is very similar. While there are some deviations at points (WW2 the most notable example, where the Deutschemark and the Japanese yen were both pulverised – note the log scale), over the long term, the outcome is the same.
Problems loading this infographic? - Please click here
Secondly, when the market gets exuberant, it tends to get really exuberant. Doublings, as in the witches’ song in Macbeth, tend to come in pairs. But thirdly -- and here’s the toil and trouble -- there can be long gaps between these pairs. Not only that, but the psychological impact of the halvings, or even just the long regimes of nothingness, can be profound. The Great Depression which led to the first two halvings, the nifty fifty bust and inflationary 1970s which led to the second fallow period, and the DotCom bust and GFC which led to the third divide-by-two all had outsized impacts on investor psychology, and arguably still do to this day.
Which begs the question, are you better off waiting for a crash before you invest? And related, are you then wise to take the money and run after a few winning hands? The short answer is no. Figure 3 shows the annualised excess returns for different quantitative rules applied from 1926 to present, where the y axis is the sell-off from peak at which you buy, and the x axis is the upside point from purchase at which you sell.
Figure 3: Annualised excess returns to portfolios with different buy and sell rules, 1926-2024
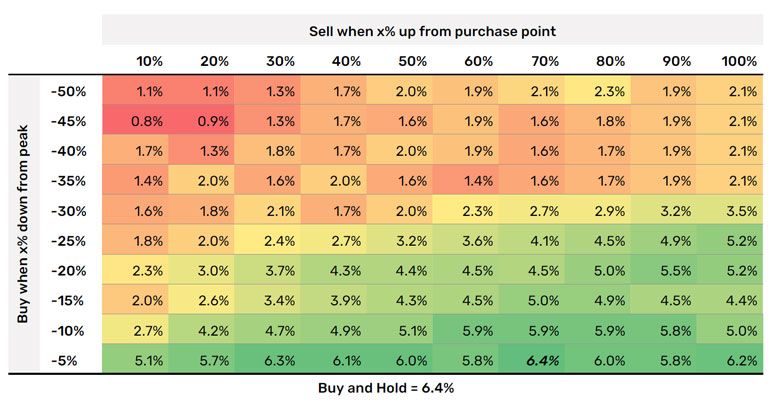
Source: Daily excess returns from Kenneth French’s online database. Returns are excess of the cash rate. We calculate drawdowns based off the trailing 3-year high.
Buy-and-hold over the same time has an annualised return of +6.4%, with a Sharpe of 0.38. Denoted in black italics, the only configuration which results in a superior annualised return is buying when the market is down 5%, and then selling when your initial investment is +70%. This results in an annualised excess return of 6.44% versus 6.41% for buy-and-hold. In Sharpe space, that equates to 0.378 versus 0.376. Not worth getting out of bed for, I’d argue.
This is an alluring implementation of the ‘be greedy when others are fearful, and fearful when others are greedy’ saw. And yet it doesn’t work. Buying at rule-of-thumb bear market threshold (-20%) and selling when you’ve doubled your money realises you 120 basis points per annum less than buy-and-hold. What does our intuition fail to grasp?
I think two things. First, we forget that division works on small numbers, as well as big ones. In the excess return space, the worst drawdown for buy-and-hold is 85% through the Great Depression. How do you get to -85%? You fall 50%, and then you fall 70%
And secondly, our intuition glazes over the wasteland of forgotten +10% years which came after the initial rip from the lows. Take the GFC, for example. From the March 2009 low to April 2011, the market rose 100%, or 39% annualised. From then until the end of 2016 it did 9.5% per annum, unspectacular by comparison, but still +67% all told.
This is a point made at a more micro level in a fascinating recent paper by Hendrik Bessembinder, looking at total cumulative returns to the 29,078 publicly listed stocks contained in the Center for Research in Security Prices (CRSP) database over the last 100 years.3 The biggest returners in cumulative space are largely old-economy, non-sexy names which in part owe their slow-gotten gains to plugging away for a really long time. Although per Figure 4, Bessembinder’s top 20 have actually outperformed the S&P over the last 10 years.
Problems loading this infographic? - Please click here
Bessembinder finds the top cumulative return belongs to Altria Group, the cigarette manufacturer, which has returned 265 million percent in its 98 years listed. That equates to a US$1 investment at inception worth some US$2.65 million today. By my reckoning, US$1 then is worth US$17 today, inflation adjusted. Not much more than your lunch money. If you think you’ve identified a great stock, it might be worth going hungry one of these days. Your great grandson will thank you.
1. While the S&P was first introduced in 1923, the earliest available historical data begins in December 1927.
2. See: https://www.man.com/maninstitute/road-ahead-regime-based-investing
3. See: https://papers.ssrn.com/sol3/papers.cfm?abstract_id=4897069
You are now leaving Man Group’s website
You are leaving Man Group’s website and entering a third-party website that is not controlled, maintained, or monitored by Man Group. Man Group is not responsible for the content or availability of the third-party website. By leaving Man Group’s website, you will be subject to the third-party website’s terms, policies and/or notices, including those related to privacy and security, as applicable.