Introduction
We have previously looked at1 how systematic macro managers might incorporate climate considerations into their process. We’d now like to turn those theories into practice. In this article, we go beyond the futures and forwards of the traditional quant toolkit and consider how we can trade a fully systematic multi-asset climate portfolio using lots of single name cash investments and a novel risk management overlay.
We look at potential challenges and how harnessing human teams and perspectives is critical for success. We also dive deeper into the technology underpinning systematic climate investment and discover that a project like this is only possible within a well-developed technology framework.
Why design a systematic, multi-asset climate portfolio?
Investors are aware that the world is warming quickly and are demanding investment options to back the transition to a lower carbon economy. Asset managers have responded, with ESG related assets set to hit $50 trillion by 2025.2
There are few, if any, options for climate investors in the systematic, multi-asset space.
However, most of this AUM is long only and focused on corporate assets, like equity and sometimes credit. Investors allocate more widely than this in their investment portfolios, but find few climate options in asset classes like government bonds and commodities. In this article, we aim to set out a blueprint for a systematic multi-asset fund, an area less well served by the investment industry, which will cover a wide range of asset classes, while implementing investment decisions without a human portfolio manager calling the shots.
We expect this to be unique in the climate investment universe and hope the ideas discussed spur innovation in the space and lead to greater choice for investors, particularly those who want to broaden their portfolio climate considerations. We expect climate focused investors too are looking for the improved diversification and better long-term risk adjusted returns that systematic multi-asset can provide3.
What challenges will we face along the way?
A project like this is fraught with challenges, which is why we expect the current climate investment options are generally not both systematic and multi-asset. At inception, we know we need to:
- Design a platform to trade thousands of assets fully systematically.
- Onboard, clean and catalogue a wide range of climate data from multiple providers.
- Set up a responsible investment framework for non-corporate assets, such as commodities.
- Provide transparency and reporting to ensure climate objectives are met.
- Apply active risk management to deliver attractive risk and return characteristics.
Not many managers have the capabilities to design a systematic, multi-asset climate portfolio.
The capabilities of a large systematic investment manager can probably cover two or three in this list, but we expect not all. Setting up a responsible investment framework and understanding climate reporting, for example, sound like items best left to specialists in the field.
Technology and specialist teams are crucial to overcome these challenges.
Balancing risk across different asset classes creates a more resilient portfolio.
Let’s get started building our systematic multi-asset portfolio. An approach often referred to as ‘risk parity’ or ‘risk-balanced multi-asset’ takes a long-only approach, combining multiple asset classes so that each gets a fair shot at contributing to the returns of the portfolio over the long run. By balancing risk and allocating to assets that perform at different times in the cycle, the portfolio is more resilient to shocks, particularly if active risk management is incorporated. Further information on this technique can be found in previous articles.4,5
The complexity is introduced when seeking to integrate climate factors into this portfolio. In a usual systematic construction, futures are used. These are highly liquid, standardised, exchange-traded contracts that are easy to work with. To illustrate the large volumes traded, Figure 1 shows the open interest in the CME E-mini S&P 500 future for a four-week period through March and April 2023.
Figure 1. Open interest in S&P 500 futures
Problems loading this infographic? - Please click here
Source: CME.
Futures are flexible from an investment perspective, but not from a climate perspective.
As we see, open interest is somewhere above 2 million contracts over this period. With each contract value $50 x the S&P 500 Index level (somewhere above 4,000 as we write), the total is hundreds of billions in dollars in open interest.
So if quants like futures, why not use them in a climate systematic programme? Well, they are simply not flexible from a climate perspective. If we hold an S&P 500 future, we have no ability to remove companies if we disagree with their sustainability credentials. We therefore need to move away from futures and towards trading single name equities. So instead of our S&P 500 future, we now hold Apple, Microsoft, Berkshire Hathaway, NVIDIA, Alphabet, Visa…
…which leads us nicely onto our first challenge and the technology and people required to tackle it.
1. Trading thousands of assets systematically
We’ve gone beyond trading futures and now have a list of tens or even hundreds of thousands of candidates we could hold in our systematic climate portfolio. Trying to rationalise this universe into something a human can comprehend and work with is a challenge. To illustrate this point, Figure 2 shows a screenshot of bond price data based on an ICE BAML index.
Figure 2. ICE BAML example bond data
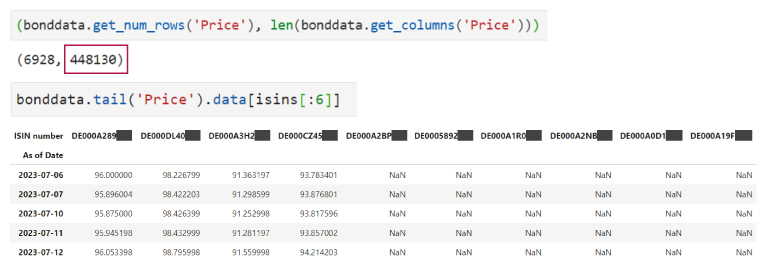
Source: ICE BAML, Man Group Database. The organisations and/or financial instruments mentioned are for reference purposes only. The content of this material should not be construed as a recommendation for their purchase or sale.
While we’ve just displayed the tail (the last five rows) and six German bonds in this example, the key feature to pay attention to is the number of columns, which is outlined in red. Here we have over 400,000. For comparison, Excel has a limit of 16,384 columns (i.e. 214), so it’s clear this is a job for a specialised tool. With nearly 7,000 rows of daily prices, uncompressed this data-frame is over 23 gigabytes of data. It’s hard to work with data this size on a typical user’s desktop or laptop. You need the right tools for the job.
Microsoft Excel is not a suitable tool for dealing with very large datasets.
The other aspect of the data visible in Figure 2 is its incompleteness, with the ‘NaN’s, short for Not a Number, representing missing values. The bond was valid at some point, but it’s not printing prices for these dates. In a matrix representation of the data like this, prices may not have been issued yet or the bonds may have already reached maturity. This creates more challenges for your technology. It needs to be able to deal with missing data. It needs to retain matured bond data in order to run accurate back tests, and it also needs to allow you to add columns seamlessly as new bonds are issued.
Despite the challenges, these ‘less normalised’ arrangements of the data are strongly preferred. The matrix formulation is much more performant. Single-asset data being contiguous in a column is the easiest structure for doing time-series analytics. Finally, the time alignment of multi-asset data across the columns, for a single measure (‘price’ here) is the easiest format for cross-sectional analysis. So which tool is suitable here?
Enter ArcticDB, a database optimised for time series data, with the ability to store data-frames with hundreds of thousands of columns, billions of rows as well as to select from it in fractions of a second. ArcticDB was developed at Man Group with big projects in mind, allowing quant researchers to work with huge data structures easily, allowing us to rationalise the selection of our climate assets. Further details on ArcticDB are beyond the scope of this note, but please visit the website here7 if interested.
Technology has thereby enabled us to work with assets at scale. The next challenge regards ESG data and how to work with it.
2. Dealing with ESG data
The market for ESG data has ballooned over the past 10 years into a multibillion-dollar industry. Figure 3 illustrates this growth, using data provider accounts to estimate the size.
Figure 3. Market size for ESG data, USD millions
Problems loading this infographic? - Please click here
Source: Opimas as at 31 March 2023. 2022 is forecast.
Not only has the growth been driven by data for research purposes, but there is now a large demand for ESG indices for benchmarking and reporting. While this has been a boon for providers, for asset managers it has created challenges around sorting, storing, cleaning, and processing this data. This is all while we figure out which ESG information is the most meaningful to the assets we want to trade.
A data catalogue makes working with ESG datasets more manageable.
To deal with part one of this problem (storing, cleaning and processing) we need an efficient data catalogue for ease of access and version control. Multiple researchers should see the same data, and transformations should be safely stowed away from the original clean dataset. Attempting to do this using a variety of Windows folders and multiple spreadsheets will get messy quickly. Besides, we also saw under challenge one, outlined earlier in this article, that the spreadsheet will collapse under the size of some of these datasets.
Our specialised data catalogue used at Man Group to solve this problem is called Codex. A sample search screen is shown in Figure 4.
Figure 4. A search in Man Group’s in house data catalogue, Codex
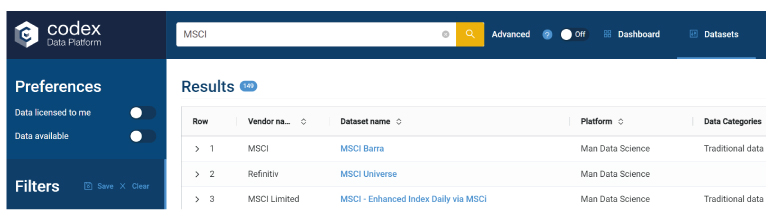
Source: Man Group Database, MSCI at 30 April 2023.
Codex is a full pipeline and system for managing data. As a specialised data lake technology, it permits the storage of both structured and unstructured data and provides a straightforward interface for browsing and investigating thousands of datasets. ESG data fits nicely here and sits at the confluence between data science and RI research. Using Codex, this data can now be put to work in asset selection, aiming to select those most aligned with fighting climate change, while avoiding those less aligned.
This is a neat solution for corporate assets, where data is abundant, but what about other asset classes, like commodities? This needs a little more thought.
3. Trading non-corporate assets such as commodities
Climate investment portfolios have historically been focused on corporate assets, most notably equities. However, investors allocate much more broadly than this, including asset classes such as commodities in their portfolios for added diversification. For systematic multi-asset portfolios, they are a key ingredient, but how can we incorporate views on climate into an allocation like this?
Certain commodities are essential in the transition to a low carbon economy.
Firstly, we acknowledge that commodities are essential in the green transition. In a future low-carbon economy, we still need to eat, have somewhere to live and move around: all these activities require commodities.
A practical approach may therefore aim to balance any negative externalities in production of the commodity against the utilisation value in the climate transition. Copper, for example, plays a key role in many technologies essential for renewable energy generation. Silver can be contrasted with gold, where the former has many industrial uses, while the latter is more damaging to extract and has few applications in the green economy. This is outlined in Figure 5.
Figure 5. When silver is more valuable than gold
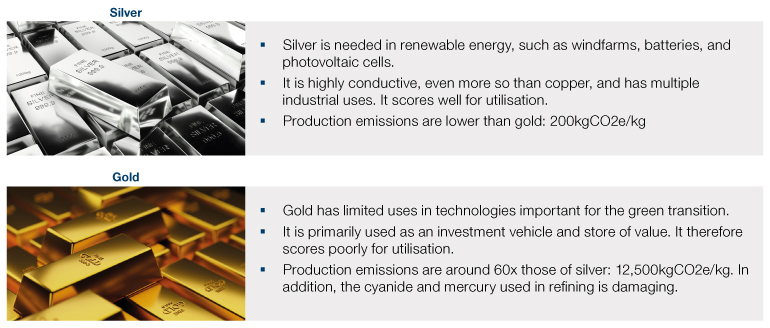
Source: RFU, Man Group database, Getty images at 31 December 2022.
Balancing negative and positive impacts helps us select which commodities to hold.
A framework for scoring commodities is therefore needed if we are to decide which commodities to trade and which to avoid. By supporting those commodities aligned with the transition, we facilitate risk sharing for both producers and consumers, alongside sending a positive signal to stakeholders, including investors, management teams and others.
The sustainability consultant RFU has developed a scoring framework along this line of thought. It aims to measure both the negative externalities in the extraction of the commodity, balanced against the usefulness of the commodity in the transition to a low-carbon economy. This is shown in Figure 6 below, where lower scores represent a higher level of environmental damage.
Figure 6. RFU scoring framework for commodity markets
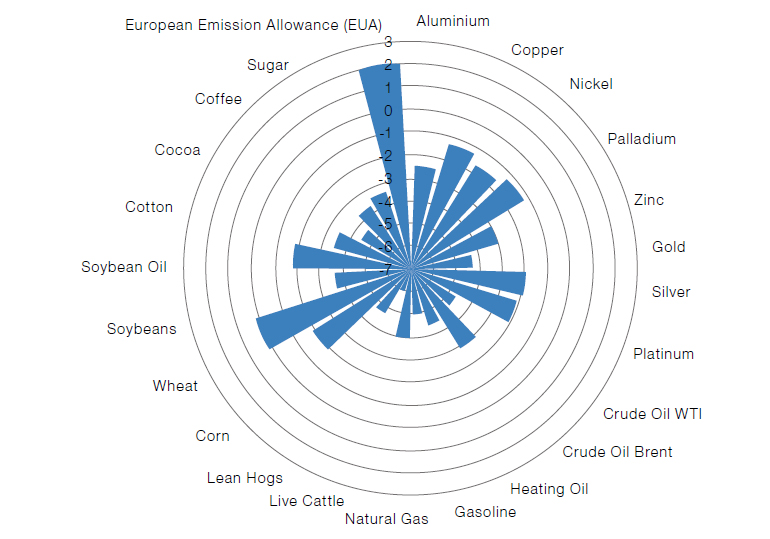
Source: RFU at 31 December 2022.
ESG in quant is an evolving area so we must contribute to the debate.
We see metals such as copper and silver are preferable to gold based on this framework. Elsewhere, wheat and corn are favoured over livestock, as would be expected from a climate standpoint. Emission permits, which put a price on released carbon, also score well. This gives us a framework to work with as we continue to build our systematic, multi-asset climate portfolio.
We acknowledge that climate integration across asset classes such as commodities is still in its infancy and this is an area of finance that will see much development in the coming years. When there is no agreed ‘correct’ approach in a quickly evolving area like this, transparency is critical. Having all the information allows investors to make informed choices based on what best aligns with their beliefs. We explore this topic further below.
4. Providing transparency on the process
Visualisation tools help investors check alignment with their own climate beliefs.
In this evolving sector, high levels of transparency can help investors decide whether the portfolio is aligned with their own climate beliefs. The next challenge is therefore how to present data in a concise and coherent way.
A piece of technology that can assist investors with their visualisation of a multi-asset climate portfolio is an ESG analytics tool. By embedding proprietary ESG scores alongside datasets from leading providers and standardising ESG reporting for investment teams and clients, an ESG analytics tool can help investors make comparisons. An example of this dashboard style reporting is shown below in Figure 7.
Figure 7: An example of an ESG analytics tool
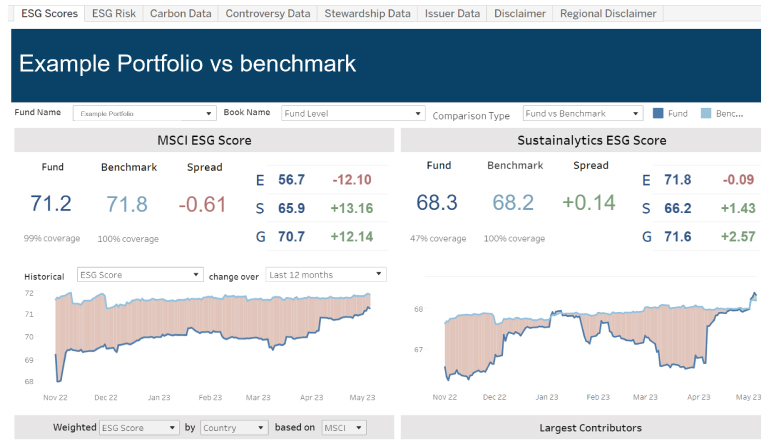
Source: MSCI, Sustainalytics at 30 April 2023.
Transparency is key at both the macro and micro level of a portfolio.
Visualisation like this is helpful at a portfolio level, but investors may also want to drill into individual securities. Figure 8 shows an example of a holistic ESG assessment on a specific company, including a view on whether it can be classified as a ‘sustainable investment’ for SFDR purposes, and how it compares against other names in its sector.
Figure 8: Visualising the ESG credential of individual companies
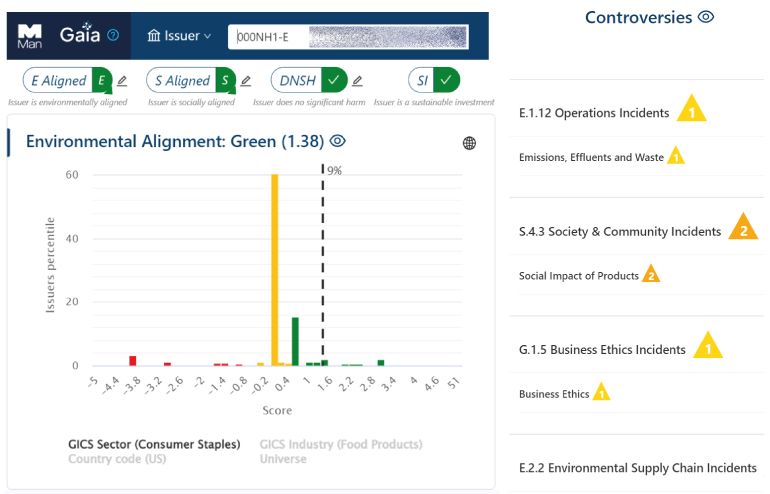
Source: Illustrative example only, using Man Group database at 30 April 2023. The organisation mentioned is for reference purposes only. The content of this material should not be construed as a recommendation for their purchase or sale.
Using technology to present data in this way makes the selection of sustainable securities more transparent. Investors can then see into the investment process and decide whether this lines up with their strategy on climate change. It also facilitates information sharing, making what might seem like a ‘black box’ process much more accessible.
With the transparency hurdles overcome, it is time to focus on performance.
5. Meeting performance goals with active risk management
Hedging with futures permits a larger holding in sustainable investments.
Alongside environmental goals, investors have risk and return targets. Therefore, our systematic multi-asset climate portfolio should deliver on these goals too. Our aim is to deliver upside capture with a mechanism for protecting the downside in more difficult markets. While this has been discussed in previous articles8,9, the question remains as to how to apply this risk-based approach to sustainable assets.
For example, to protect our climate portfolio in turbulent times, we might consider lowering exposures by selling down some investments. This is good as it lowers the risk of steep losses if markets fall. However, it has two major drawbacks:
- From an environmental perspective, selling the portfolio down is not ideal as we have now sold a chunk of our sustainable assets.
- From a financial perspective it’s also not optimal as cash assets are expensive to trade so we’ve now incurred losses via trading costs.
A neater solution to this is to hedge using futures because:
- We can now hold more exposure in sustainable assets in our long portfolio, in the knowledge we have a futures hedge to protect us in difficult times.
- Futures are cheap to trade, so we have solved our transaction cost issue.
Figure 9. Using futures to hedge risk in our hypothetical systematic climate portfolio.
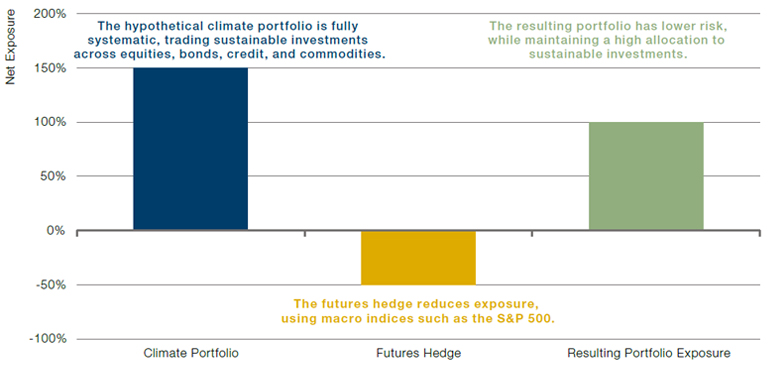
Source: Schematic illustation, not representative of an actual investment strategy or fund. Please see the important information linked at the end of this document for additional information on hypothetical results.
As we see in Figure 9, by using liquid futures contracts to hedge our exposure, we maintain a high allocation to our sustainable assets in the hypothetical climate portfolio, while still reducing our overall risk.
Using futures also lowers trading costs.
Finally, we need to test the performance of our hypothetical systematic, multi-asset climate portfolio. We’ve combined humans and technology to build an investment programme that trades thousands of sustainable cash assets and uses systematic techniques to manage risk. But how would this compare to other approaches?
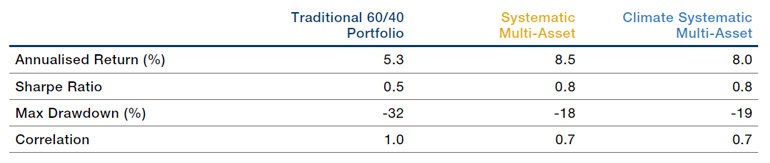
Figure 10. Simulated performance comparison
Problems loading this infographic? - Please click here
Performance simulated from January 2007 to December 2022. Traditional portfolio represented by 60/40 Portfolio based on 60% MSCI World Net Total Return and 40% Barclay Capital Global Aggregate Bond index rebalanced monthly. Hypothetical Systematic Multi-Asset and Climate Focused Systematic Multi-Asset portfolios are shown net of an example fee load of 0.95% management fee. Please see the important information linked at the end of this document for additional information on hypothetical results. Source: Man Group database.
You don’t need a view on ESG alpha to still deliver attractive risk and return characteristics.
We compare our risk-managed hypothetical systematic portfolio with a traditional portfolio in Figure 10. Here, in navy blue, is a 60% equities and 40% bonds ‘traditional’ investment portfolio. By balancing risk and using other techniques discussed7 we move to the gold line, leading to an improved risk-adjusted return and more favourable drawdown characteristics.
The lighter blue line is perhaps surprising. Here we take the hypothetical systematic multi-asset portfolio and integrate climate considerations across all the asset classes traded, which is akin to the portfolio we have built together throughout this note. What stands out is the similarity in performance against the hypothetical systematic portfolio without climate integration, with the lighter blue and gold lines tracking very closely. This indicates that we can shift our underlying allocations towards a more positive climate impact, while maintaining attractive risk and return characteristics. In other words, you don’t need to believe that ESG adds alpha to still achieve your return objectives10.
Conclusion
In this article, we’ve set out a blueprint for a systematic multi-asset climate programme, arguing that only a well-resourced investment manager, working on a leading technology platform can expect to deliver such a solution given the significant challenges involved. We have explored each of the main challenges in turn, including sorting, storing, cleaning, and processing data, trading non-corporate assets and delivering transparency, and argued that high quality researchers, supported by responsible investment and data science teams, are key to addressing these challenges. Finally, by harnessing the power of active risk management, we have shown how attractive risk and return characteristics can be achieved while acting in the best interests of the environment.
We also acknowledge that the world of finance is still in the early stages on the journey of integrating climate into systematic multi-asset portfolios, but we hope this article stimulates new conversations and motivates others to think about the challenges and possible solutions.
1. H. Moore. Can Systematic Investors Plead the Fifth on RI? Available on Man Institute, 2021. www.man.com/maninstitute/can-systematic-investors-plead-fifth-on-ri
2. Source: Bloomberg Intelligence
3. R. Korgaonkar and G. Robertson. The Z-shift framework. Available on Man Institute, 2021. www.man.com/maninstitute/z-shift-framework
4. R. Korgaonkar and G. Robertson. The Z-shift framework. Available on Man Institute, 2021. www.man.com/maninstitute/z-shift-framework
5. R Korgaonkar and T. A. Zeid. Let's Admit It: Nobody Knows What's Coming Next. Available on Man Institute, 2021. www.man.com/maninstitute/lets-admit-it
6. R. Korgaonkar. Gearing Up for Uncertainty. Available on Man Institute, 2021. www.man.com/maninstitute/gearing-up-for-uncertainty
7. Arctic DB: https://arcticdb.io/
8. R Korgaonkar and T. A. Zeid. Let's Admit It: Nobody Knows What's Coming Next. Available on Man Institute, 2021. www.man.com/maninstitute/lets-admit-it
9. R. Korgaonkar and G. Robertson. Active Risk Management in Practice. 2021. https://www.man.com/maninstitute/active-risk-management-in-practice
10. G. Robertson and H. Moore. We Don't Need an ESG Alpha Bet. 2023. www.man.com/maninstitute/we-dont-need-an-esg
You are now leaving Man Group’s website
You are leaving Man Group’s website and entering a third-party website that is not controlled, maintained, or monitored by Man Group. Man Group is not responsible for the content or availability of the third-party website. By leaving Man Group’s website, you will be subject to the third-party website’s terms, policies and/or notices, including those related to privacy and security, as applicable.