Introduction
Diversification is the cornerstone of a systematic manager’s strategies: greater diversification means a larger pool from which to capture different return streams.
Driven by recent rule changes, China offers access to some of the world’s most liquid markets: in September 2020, a long-anticipated rule change was announced by the China Securities Regulatory Commission (‘CSRC’), effective 1 November, 2020. This rule change will gradually expand the investment scope of a Qualified Foreign Institutional Investors1 (‘QFII’) license to include, amongst others, futures contracts and private investment funds. This new development potentially opens investment opportunities for offshore investors which hitherto have only been accessible to onshore Chinese investors. It complements existing offshore access routes such as Stock Connect, Bond Connect and China Interbank Bond Market (‘CIBM’) and facilitates greater access to China’s domestic capital markets for offshore investors. All of these changes should be a good thing for investors in systematic strategies, in our view.
In this article, we discuss the size of Chinese financial markets, their diversification potential in comparison to their global counterparts and summarise how to access them. Finally, relying on our seven years of experience of trading onshore markets, we explore whether trading these markets using well-known investment strategies may provide attractive return and diversification characteristics when compared with commonly traded global markets.
Size of China’s Financial Markets
China, currently the world’s second-largest economy as measured by GDP, has seen enormous economic growth over the last 30 years, growing from USD397 billion in 1990 to USD14.9 trillion by the end of 20202, an average annual growth rate of 13.2%. This growth has translated to its financial and commodity markets.
Commodities
Following major economic reforms in 1978, a shift to urbanisation and industrialisation, as well as rising per capita incomes, have led to increased demand for commodities such as agricultural produce, energies and metals. Commodity futures, originally established to meet the hedging needs of farmers and producers, nowadays serve a bigger role in the Chinese economy through improved pricing and transparency. Commodity futures are traded across the nation’s three commodity exchanges: the Dalian Commodity Exchange (‘DCE’), the Shanghai Futures Exchange (‘SFE’) and the Zhengzhou Commodity Exchange (‘ZCE’). In terms of their size relative to global exchanges, China’s commodity exchanges rank third in aggregate in the top 10 largest futures and options exchanges by volume (Figure 1). It is worth noting that not all exchanges listed in Figure 1 solely trade commodities or at all, unlike the DCE, SFE and ZCE.
Problems loading this infographic? - Please click here
Date range: Jan – Dec 2020. Source: FIA; as of 31 December 2020. Ranked by number of contracts traded and/or cleared. Futures and options volume broken down by subsidiary exchanges. NSE India: National Stock Exchange of India. ICE: Intercontinental Exchange. China aggregate: Combination of Dalian Commodity Exchange, Shanghai Futures Exchange and Zhengzhou Commodity Exchange.
As of February 2021, 63 commodity futures were listed across the DCE, SFE and ZCE. This list is continually growing, with the most recent addition being in January 2021 when China, the world’s top pork consumer and producer, launched its first physically delivered live-animal futures contract. Moreover, as part of its pledge to become carbon neutral by 2060, China plans to launch carbon emission futures on a still-to-be-developed futures exchange in Guangzhou.
Volumes at the market level, as measured by number of contracts traded, also compare favourably versus global commodity futures. Figure 2 shows a selection of the most traded Chinese commodity markets (yellow bars) versus global commodity markets (blue bars). In 2020, the top five traded commodity futures markets in the world were Chinese commodities. Our selected list highlights an additional appealing feature of Chinese markets, namely, the pool of commodities includes unique futures markets that do not exist elsewhere, for example apple, bitumen and egg futures.
Problems loading this infographic? - Please click here
Date range: Jan – Dec 2020. Source: FIA; as of 31 December 2020. Volume for exchange-traded futures is measured by the number of contracts traded on a round-trip basis to avoid double-counting.
Equities and Bond Markets
China is also a major player in traditional asset classes, such as equities and bonds. Figure 3 below highlights the five largest equity market capitalisations by country as at the end of 2020. Having ended 2020 with a new all-time high of USD10.9 trillion, the Chinese equity market solidified its status as the world’s second-largest, lagging only that of the United States. In bonds, China holds the title of world’s second-largest as well, once again behind the United States, measured as total debt securities outstanding according to data published by the Bank for International Settlements (‘BIS’, Figure 4).
Problems loading this infographic? - Please click here
Source: Bloomberg; as of 31 December 2020.
Problems loading this infographic? - Please click here
Source: BIS, total debt securities outstanding; as of 30 June 2020.
Furthermore, foreign participation in onshore Chinese equity and bond markets has seen remarkable growth in the last three years. Volumes through offshore access routes into Mainland China A-shares (Northbound Stock Connect) and the domestic bond market (China Interbank Bond Market), have tripled and doubled, respectively, between January 2018 and October 2020.3 Much of this growth can be attributed to the Index inclusion of China A-shares in MSCI indices, as well as the inclusion of China in various global bond indices such as the Bloomberg Barclays Global Aggregate Index and JP Morgan’s Emerging Market Bond Index. More passive flows are expected, however, as FTSE Russell’s World Government Bond Index is set to begin phasing in a 5.7% ultimate weighting to China starting October 2021.
Diversification
Arguably, the most appealing characteristic of Chinese financial markets is their diversification potential in comparison to their global counterparts. Below, we show this is indeed the case and the effect is persistent across asset classes.
Commodities
The likes of bitumen and eggs futures mean that a large portion of commodity markets listed on Chinese exchanges are one of a kind. However, these unique markets are only truly relevant from an alpha perspective if they exhibit a low correlation to global commodity markets. This is confirmed in Table 1, which shows the correlation between the Chinese commodities listed in Figure 1 and major commodity markets traded outside of China. Chinese commodity names are highlighted in light blue.
Table 1. Monthly Correlation of Chinese Commodities With Major Global Commodities
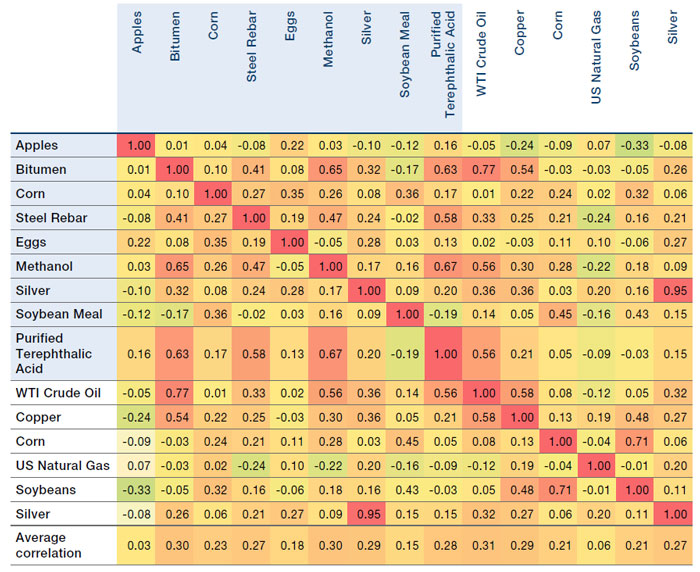
Date range: Jan 2015 – Dec 2020. Correlation based on monthly returns in US dollars. Source: Man Group Database; as of 31 December 2020.
Apples and eggs are unique agricultural markets. However, even corn, for example, only has a 0.24 correlation its US counterpart, as a result of differing local growing conditions and the cost of transport and substitution. Strikingly, it is not even its most correlated market. Examples of higher correlation include bitumen and silver. Bitumen, used for road surfacing and roofing, is a highly viscous residue resultant from petroleum distillation and naturally has some higher correlation to the likes of gasoline and crude oil. It is worth noting that some Chinese commodities not listed in Table 1 – such as Chinese crude oil – also have a higher correlation to their global counterparts.
Equities
Table 2 shows the correlation between major global equity indices since 2006. The correlation between China’s CSI 300 and other major equity indices is less than 50% on average. It is also worth noting that the correlation between non-Chinese equity indices is high, ranging from 0.65 to 0.93.
Table 2. Monthly Correlation of China’s CSI 300 Index With Major Equity Market Indices
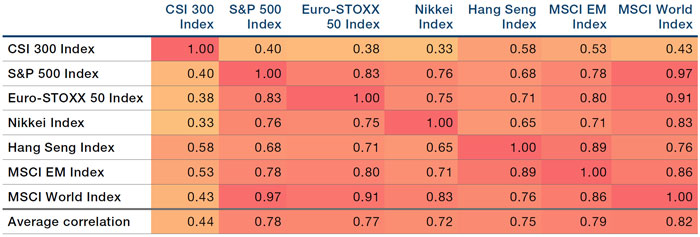
Date range: 1 January 2006 to 31 December 2020. EM: Emerging Markets. Source: Bloomberg, MSCI.
Bonds
With developed market bond yields at very low levels, foreign investors may find Chinese bonds appealing. As Figure 5 illustrates, Chinese bonds neither show the reduction in yields seen across developed markets, nor their current absolute levels of 1% or less.
Problems loading this infographic? - Please click here
Date range: 2011 to 2020. Source: Bloomberg; as of 31 December 2020.
These observations explain the low average correlation between Chinese and other bonds in Table 3. Furthermore, Chinese bonds show a low correlation with developed and emerging market bond indices. Its highest correlation is with Pan-Asia Local Currency, which is not surprising given China represents around 25% of the index.
Table 3. Monthly Correlation of Chinese Bonds to Global Bond Benchmarks
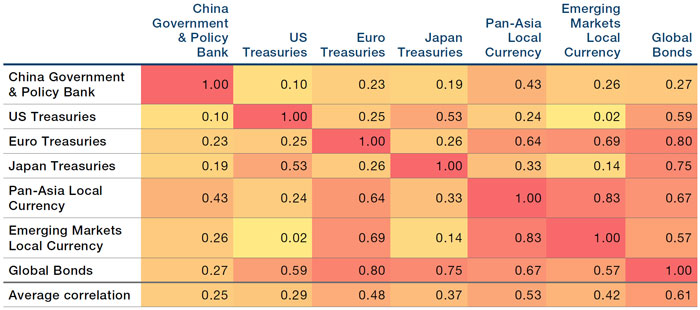
Date range: 2006 to 2020. China Government & Policy Bank: Bloomberg Barclays China Treasury + Policy Bank 1-10 Years TR Index Unhedged USD. US Treasuries: Bloomberg Barclays US Treasury Total Return Unhedged USD. Euro Treasuries: Bloomberg Barclays Euro Aggregate Treasury Total Return Index Value Unhedged USD. Japan Treasuries: Bloomberg Barclays Asian-Pacific Japan Treasury Total Return Index Unhedged USD. Pan-Asia Local Currency: Markit iBoxx ABF Pan-Asia Unhedged Total Return Index USD. Emerging Markets Local Currency: J.P. Morgan GBI-EM Global Diversified Composite Unhedged USD. Global Bonds: Bloomberg Barclays Global Agg Treasuries Total Return Index Value Unhedged USD.
Source: Bloomberg, Markit, J.P. Morgan; as of 31 December 2020.
Access to China’s Financial Markets
With the clear advantage of accessing a diverse and liquid set of Chinese markets, it is perhaps no surprise that, even before QFII, there have been a range of access routes available to offshore investors. In this section, we highlight the main routes, discuss what changes QFII access may bring, and offer some insights based on our experience having traded these Chinese markets from an onshore perspective since 2014.
Commodities
The newly expanded QFII investment scope announced late 2020 was arguably most exciting for the commodities asset class. Under QFII, contracts need to be submitted for approval by the exchanges and approved by the CSRC. At the time of writing, a total of 20 commodity markets have been submitted for CSRC approval for QFII access by the exchanges, although no commodity futures have so far been approved.
Foreign investors can also trade so-called internationalised commodity futures contracts without a QFII. Crude oil was the first contract to internationalise in 2018 in China’s effort to strengthen its pricing power in the commodities markets it dominates. Currently, a total of seven international contracts are available for trading, with the most recent addition being palm olein in December 2020. Despite these developments around international contracts, the QFII route is expected to offer a larger universe of markets.
Equities
Cash Equities
Access to China’s mainland equity markets has improved since the launch of the QFII scheme in 2002. Chinese A-shares, stocks traded on the Shanghai and Shenzhen stock exchanges, are currently accessible via QFII and Stock Connect. With respect to QFII, license holders can access a much broader set of cash equities, compared with the Stock Connect programmes. As at 31 December, 2020, the number of companies listed on the Shanghai and Shenzhen stock exchanges totalled 4,233, including large cap, small/mid cap and tech boards such as China’s ChiNext and STAR Markets. Meanwhile, stocks available via the Stock Connect programmes are limited to only 1,468 A-shares (as at 31 December). Both QFII and Stock Connect routes permit shorting, although in our experience, borrow costs can be prohibitive and may render some investment strategies impractical.
Futures
QFII grants license holders’ access to stock index futures, such as the CSI 300 index, although currently this is permissible for hedging purposes only.
Bonds
Cash Bonds
Cash bonds can currently be accessed by foreign investors via CIBM Direct and Bond Connect, with the former being the onshore inter-bank market, accessible to a limited set of specialised foreign institutions, and the latter accessible more broadly via Hong Kong. Both CIBM Direct and Bond Connect offer access to onshore Chinese bond markets which are broadly classified into the following groups: local government bonds, policy bank bonds, corporate bonds and central government bonds. CIBM Direct, however, allows access to a broader range of instruments such as repos and interest rate swaps as well as offering greater choice in counterparties than Bond Connect.
Man AHL has been trading cash bonds onshore through CIBM Direct since 2020 primarily because of its relatively lower costs, but QFII will open up this route for offshore investors as well.
Futures
The use of Chinese cash bonds in alternatives investing is somewhat constrained as they require being fully funded and therefore are limited to unlevered use. Futures would offer a clear advantage here, but while in scope under the recently broadened QFII investment rules, bond futures are not expected to be approved for trading through QFII until at least 2022. It also remains uncertain whether, once approved, bond futures would only be permissible for hedging purposes as is the case with stock index futures.
Potential Investment Strategies
Previous sections have established that Chinese markets are large, liquid and exhibit a low correlation to their global counterparts, and this holds whatever asset class is being discussed. Further, it appears that QFII will provide the most encompassing access route to offshore investors given its breadth of market access across all asset classes and lower trading costs.
As a systematic investment manager which has spent more than 30 years searching for uncorrelated markets, and with more than seven years’ experience trading Chinese markets in onshore vehicles, we relish the opportunity that these markets open up for offshore investors. Moreover, Man AHL was one of the first global systematic managers to receive approval for a QFII license in China in September 2020. In the remainder of this section we highlight two investment strategies we believe could potentially offer attractive uncorrelated alpha.
Commodities Momentum
We first focus on momentum, a strategy we have been trading well over 30 years. We focus on commodity futures because of the doubts expressed to short equity and bond futures under QFII in the immediate future. We also use the assumption that all Chinese commodity contracts are approved and include only Chinese and global commodity contracts that fit our internal liquidity criteria. In this universe of 37 Chinese and 14 global commodity markets, we apply a binary model based on a 10- and 40-day moving average crossover, and target a return volatility of 15%. We exclude any management and performance fees, however, expected trading costs are included. Figure 6 illustrates that Chinese commodity markets exhibit far more consistent alpha generation, outperforming global commodities in 13 years out of 15.
Problems loading this infographic? - Please click here
Date range: Jan 2006 – Dec 2020. Source: Man Group.
Simulated past performance is not indicative of future results. Returns may increase or decrease as a result of currency fluctuations.
The above results should be considered hypothetical as they are not based upon actual results. Please see the end of this paper for additional important information on hypothetical results.
Balanced Multi-Asset
Equity and bonds markets are accessible through offshore routes although shorting proves impractical in our experience. Because of this, we find it worthwhile exploring a long-only balanced multi-asset portfolio with a risk allocation of 60% to equities and 40% to bonds. We use a risk-adjusted approach as notional allocations to an equity/bond portfolio tend to favour equities due to their higher volatility contribution. This is particularly important when investing in Chinese markets as the annualised volatility of the CSI 300 Index in China has been around 28% since 1 January, 2006, while MSCI World Index achieved an annualised volatility of 18% over the same timeframe.
In China we use the CSI 300 Index and the CSI Aggregate Bond Index as a proxy for equities and bonds, respectively, while the global portfolio uses the MSCI World Index and Bloomberg Barclays Global Aggregate Bond Index. Additionally, it is reasonable to assume an institutional investor may not have a standalone allocation to China but rather include as a diversifier to an existing global portfolio. Because of this, we compare a global 60/40 portfolio versus a portfolio with 80% weight to global and 20% to China. Both portfolios have been adjusted to 10% volatility and are shown gross of management and performance fees and excluding trading costs. Highlighted in Figure 7, the blended 80% Global/20% China portfolio outperforms the global version by 2.3% per annum. Meanwhile, the correlation between the China and Global portfolios was 0.23 over the 15-year period. These observations make the case that a modest allocation to China could benefit traditional equity/bond portfolios.
Problems loading this infographic? - Please click here
Date range: Jan 2006 – Dec 2020. Source: Man Group Database, Bloomberg.
Simulated past performance is not indicative of future results. Returns may increase or decrease as a result of currency fluctuations.
The above results should be considered hypothetical as they are not based upon actual results. Please see the end of this paper for additional important information on hypothetical results.
China’s Response to the Pandemic
Furthermore, in the current uncertain market environment, China’s economy, the world’s second-largest behind the United States since 20104, has shown superior resilience to the pandemic than others. Figure 8 shows the International Monetary Fund’s January 2021 projections (solid lines) compared with the year before (dotted lines) of major economy groups and China. While advanced economies (‘AEs’) and emerging market and developing economies (‘EMDEs’) saw GDP declines in 2020, China’s GDP grew by 3.2%, aided by responsive government actions through effective lockdown measures, increased public investment to offset private sector capital spending as well as liquidity injections to ease banks’ access to funding.
Figure 8 illustrates that, in addition to our historic observations that Chinese markets have offered great diversification to investors, there is good evidence to suggest that this diversification is likely to persist in the years to come.
Problems loading this infographic? - Please click here
Date range: Q4 2019 – Q4 2022. Source: IMF staff estimates. AEs= advanced economies, EMDEs = emerging market and developing economies, WEO = World Economic Outlook.
Conclusion
Recent regulatory changes have opened the door even wider for foreign investors to access onshore Chinese markets. Access to China’s domestic capital markets continues to be relaxed while investors with a QFII license are well positioned to benefit from greater access, lower trading costs and further potential expansion of the permissible instruments. Whether it is equities, bonds or commodities, China is already one of the largest markets in the world. Furthermore, traditional assets such as equities and bonds have so far exhibited a low correlation to global benchmarks while commodity markets tend to be unique to China. An alternative investment strategy such as momentum on commodities appears to be diversifying and exhibits high alpha potential while a well-managed, long-only China equity/bond portfolio is both a great diversifier and potential return enhancer in global equity/bond portfolios.
1. QFII is a certification programme launched in 2002 by the Chinese government, allowing foreign or offshore institutional investors to invest in exchange-traded China A-shares, bonds and fixed income products traded in the China inter-bank bond market, among other instruments as permitted under QFII rules, directly within China’s domestic markets.
2. GDP quoted at current prices in US dollars. Source: IMF.
3. Source: HKEX Investor Presentation, November 2020.
4. Source: International Monetary Fund.
You are now leaving Man Group’s website
You are leaving Man Group’s website and entering a third-party website that is not controlled, maintained, or monitored by Man Group. Man Group is not responsible for the content or availability of the third-party website. By leaving Man Group’s website, you will be subject to the third-party website’s terms, policies and/or notices, including those related to privacy and security, as applicable.