Key takeaways:
- The recent inflationary episode left some investors questioning the defensive role bonds play in their portfolios
- A combination of trend-following and long/short quality stocks can be viewed as a diversifying alternative
- We highlight the value of blending this defensive couple with a ‘traditional’ global 60/40 portfolio, improving the overall risk-adjusted return
Introduction
The reliability of bonds as a defensive diversifier was brought into question in 2022, particularly in light of the inflationary environment. Motivated by the insights shared by our colleagues in The Best of Strategies for the Worst of Times, we set out to explore whether two strategies with defensive properties – long/short quality (L/S quality) stocks and trend-following – could offer an alternative.
Both historically performed well in equity crises yet had positive carry in the good times.
The results, outlined in Trend-Following and Long/Short Quality: Attack Wins You Games, Defence Wins You Titles, were indeed encouraging; both historically performed well in equity crises yet had positive carry in the good times. Hence the ‘yieldy put’ moniker in the title of this paper. Further, the two strategies are complementary to each other, with L/S quality often capturing the sudden ‘flight-to-quality’ effect that can potentially derail trend-following strategies.
We concluded that it would be unwise not to capitalise on the diversification and complementarity on offer. In this paper, we delve more deeply into how incorporating a combination of L/S quality and trend-following can improve traditional portfolios.
Creating the Dynamic Duo
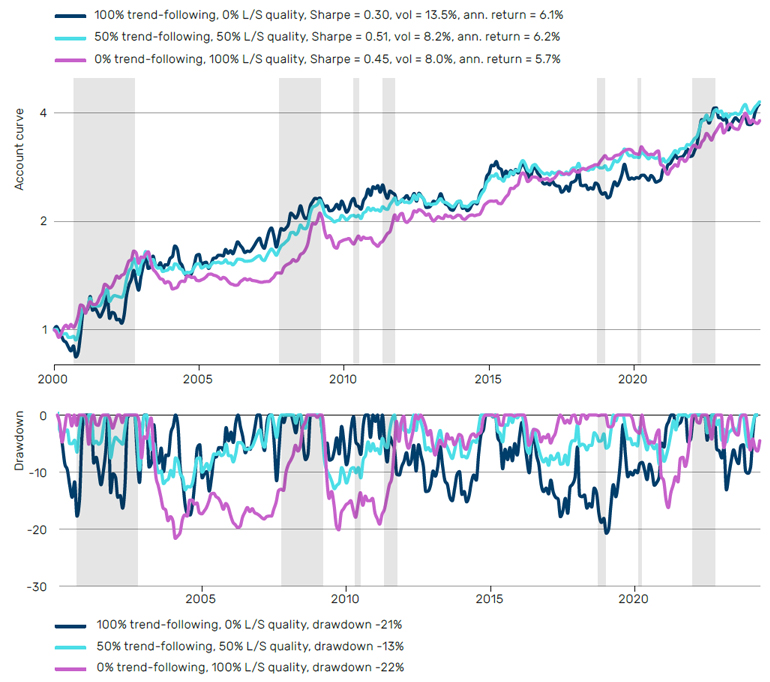
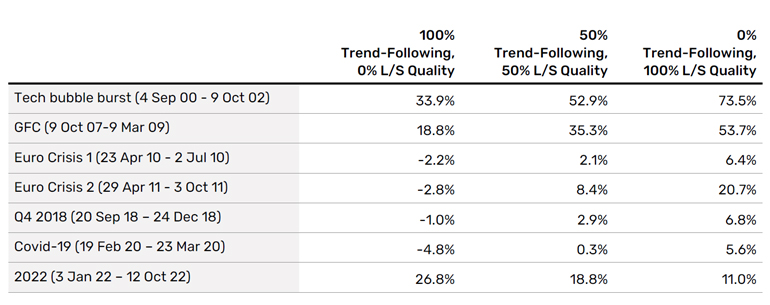
In Figure 1, we show the account curve and drawdowns of trend-following, proxied by the Société Générale (SG) Trend index, and L/S quality, proxied by the Quality-Minus-Junk (QMJ) Factor from Asness, Frazzini and Pedersen (2019), together with an equal blend of the two. Table 1 shows the performance of each combination, while Appendix 1 focuses on equity crisis periods, as defined in The Best of Strategies for the Worst of Times.
Figure 1. Trend-following (SG Trend Index), and L/S quality (QMJ Daily) since the inception of the SG Trend index in 2000. Account curve (top), drawdown (bottom)

Trend-following represented by SG Trend Index. L/S Quality represented by QMJ. Source: Man Group database, Bloomberg, AQR Capital Management, Société Générale. Date range 1 January 2000 to 30 April 2024. Shaded equity drawdowns from ‘The Best Strategies for Worst of Times’. Please see the important information linked at the end of this document for additional information on hypothetical results.
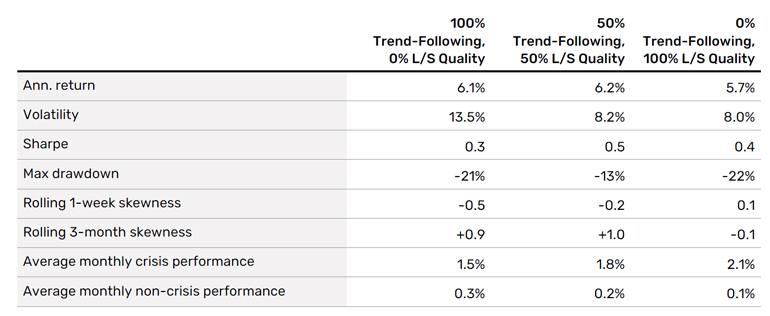
Table 1. Statistics for hypothetical portfolio combinations of trend-following and L/S quality. Date range: 1 January 2000 to 30 April 2024

A sudden (downward) shock to risk assets is typically accompanied by investors seeking shelter in quality assets.
The increase in Sharpe ratio from 100% trend-following to our blend is intuitive given we are diversifying across two lowly correlated strategies. Our skewness results are worth further discussion, however. Note that trend-following’s renowned ‘positive skew’ properties extend only to the three-month horizon, where the strategy has enough time to change position, potentially adapting to market sell-offs. On a one-week basis, skewness in trend-following is negative – see Trend Following: A Different Point of Skew for further discussion as to why this is the case.
As we highlighted in Trend-Following and Long/Short Quality: Attack Wins You Games, Defence Wins You Titles, this is where the L/S quality component comes to the rescue. A sudden (downward) shock to risk assets is typically accompanied by investors seeking shelter in quality assets, and hence the inclusion of this strategy results in an improved skewness profile, even over short time horizons, such as one week.
The Yieldy Put
With our trend-following and L/S quality combination, we have created a hypothetical yieldy put portfolio; one which has (historically at least) generated positive returns in crises (the put component, +1.8% per month from Table 1), yet does not have a negative cost of carry in the good times (the yieldy component, +0.2% per month). In contrast, the average cost of carry of a traditional protection strategy, rolling at-the-money (ATM) long puts, from The Best of Strategies for the Worst of Times was -0.9% during non-crisis months, leading to a negative total return over the full period. Further, by combining the strategies, it means our yieldy put portfolio is less sensitive to reversal risk, such as that experienced by trend-following strategies during the Silicon Valley Bank crisis of 2023.
By combining the strategies, it means our yieldy put portfolio is less sensitive to reversal risk.
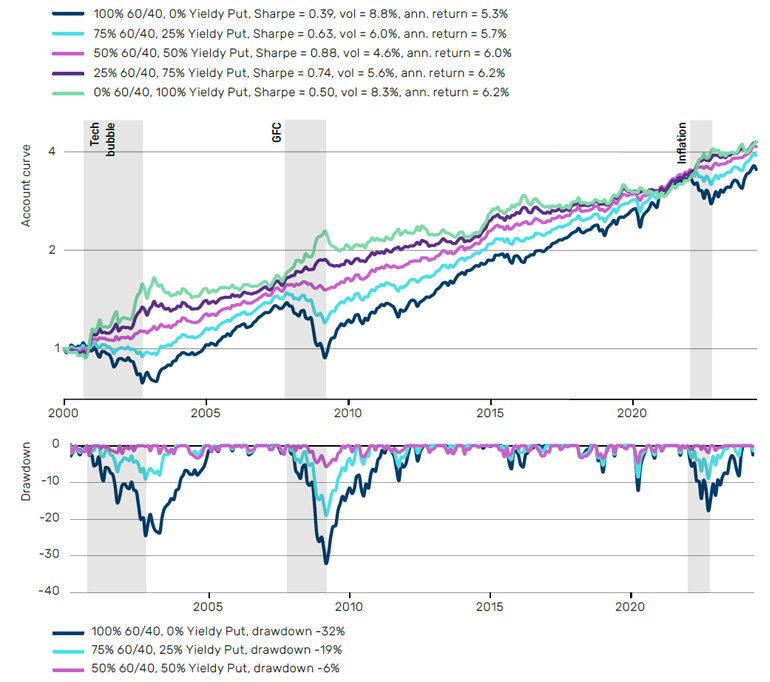
We investigate the value of the yieldy put by combining it with the ubiquitous ‘traditional’ global 60/40 portfolio in Figure 2. Note how the risk-adjusted returns of both our traditional portfolio and yieldy put strategy are about the same, but the properties of the 50/50 blend are significantly better. Relative to the traditional portfolio alone, the Sharpe ratio more than doubles, driven by both an increase in return and reduction in volatility, all while the drawdown is reduced by a factor of five – from 32% to 6%.
Figure 2. 60/40 and yieldy put (50% trend-following (SG Trend index), and 50% L/S quality (QMJ)) since inception of SG Trend index in 2000. Account curve (top), drawdown (bottom)

60/40 represented by 60% MSCI World Net Total Return Index hedged to USD and 40% Barclays Bloomberg Global Aggregate Net Total Return Index hedged to USD. Trend-following represented by SG Trend Index. L/S Quality represented by QMJ Daily. Source: Man Group database, Bloomberg, AQR Capital Management, Société Générale. Date range 1 January 2000 to 30 April 2024.
Table 2. Statistics for hypothetical portfolios. Yieldy put is 50/50 L/S quality and trend-following

Intuitively, a pivotal driver of the Sharpe improvement for the 50/50 blend is the contribution of our yieldy put portfolio during notable crises, including the global financial crisis (GFC) and recent inflationary period, where we see the light green line increasing. The drawdowns of the 50/50 combination (pink line) are also significantly better than a pure traditional 60/40 (navy line).
Another crucial contribution of the 60/40 portfolio is the mitigation of upside reversal risk for the defensive couple.
And while it is all well and good to make sure we’re protected in the bad times, we still need to keep pace during the good to avoid taking excessive tracking error, a concept we discuss in more detail in Honey, I Shrunk the Trend-Following. The 60/40 portfolio is beneficial in this regard, contributing a greater amount in non-crisis periods, particularly in 2009-19 when trend-following strategies struggled.
Another crucial contribution of the 60/40 portfolio is the mitigation of upside reversal risk for the defensive couple. In the analysis from our previous paper of the ten worst trend-following reversals, which we measured using rolling five-day returns, there were three instances where L/S quality finished in negative territory as well. Interestingly, in all three instances, stocks rallied higher. So, in effect, the event that triggered a trend reversal in these cases was the opposite of ‘flight to quality’. The equity beta from the 60/40 portfolio, however, captures the equity upside for the combination, thereby enabling the 50/50 portfolio to deliver a stable return in both good and bad market environments.
Conclusion: Diversification puts alts on top
Liquid alternative strategies, specifically trend-following and L/S quality stocks, could be viewed as the new bonds.
For much of the last three decades, bonds have been the yieldy put of choice; after all, they made money in the long term and did well when equities didn’t. As pointed out in The Best of Strategies for the Worst of Times, however, inflationary episodes, such as 2022, are bonds’ Achilles heel and underscore that they may not always be a reliable defensive diversifier. This has subsequently left many investors searching for a viable alternative.
In this paper, we have suggested that liquid alternative strategies, specifically trend-following and L/S quality stocks, could be viewed as the new bonds, providing much sought-after diversification and defensiveness.
Spoiler alert: the story does not end here. We can do more. The addition of our yieldy put strategy to our traditional portfolio resulted in increased Sharpe and lower drawdowns, all for the same return. But what if we were happy with the Sharpe and drawdown of our traditional portfolio? How about monetising our improved risk properties? We touched on this in Trend-Following: If it Moves, Monetise It, but we will explore these ideas in greater depth in our next paper.
Appendix
Appendix 1. Statistics for hypothetical portfolio combinations of trend-following and L/S quality during equity crisis periods

Bibliography
Harvey, C, R, Hoyle, E, Sargaison, M, Taylor, D, van Hemert, O. (2019), “The Best of Strategies for the Worst of Times”, Man Institute, Available at: https://www.man.com/maninstitute/best-of-strategies-for-the-worst-of-times
Panjabi, Y, Robertson, G. (2023) “Honey, I Shrunk the Trend-Following”, Man Institute, Available at: https://www.man.com/maninstitute/honey-i-shrunk-the-trend-following
Panjabi, Y, Robertson, G. (2023) “Trend-Following and Long/Short Quality: Attack Wins You Games, Defence Wins You Titles, Man Institute, Available at: https://www.man.com/maninstitute/trend-following-long-short-quality-attack-wins
Robertson, G. (2023), “Trend-Following: If it Moves, Monetise it!”, Man Institute, Available at: https://www.man.com/maninstitute/trend-following-if-it-moves-monetise
Robertson, G, Goodall,. R. (2023), “Trend-Following: A Different Point of Skew”, Man Institute, Available at: https://www.man.com/maninstitute/trend-following-different-point-skew
Index Definitions
Société Générale (SG) Trend Index
This is an index of CTA funds that is equal weighted and calculates the daily rate of return for a pool of CTAs selected from the larger managers in the universe.
Quality-Minus-Junk (QMJ) Factor
Takes a long position in high-quality stocks while shorting low-quality stocks.
MSCI World Net Total Return Index
The MSCI World Index captures large and mid cap representation across 23 Developed Markets (DM) countries.
Barclays Bloomberg Global Aggregate Net Total Return Index
The index is a measure of global investment grade debt from a multitude local currency markets. This multi-currency benchmark includes treasury, government-related, corporate and securitized fixed-rate bonds from both developed and emerging markets issuers.
You are now leaving Man Group’s website
You are leaving Man Group’s website and entering a third-party website that is not controlled, maintained, or monitored by Man Group. Man Group is not responsible for the content or availability of the third-party website. By leaving Man Group’s website, you will be subject to the third-party website’s terms, policies and/or notices, including those related to privacy and security, as applicable.