Introduction
Frequent readers of Man Institute will recall trend-following’s desirable properties: comparable long-term returns to equities, zero long-term correlation to traditional assets, and historically-observed strong performance in crisis periods. Many of our readers may even be investors in trend-following programmes for these exact reasons. But a natural next question, and indeed one that we have been increasingly fielding, is ‘how much trend-following should I hold in my portfolio?’
The textbook answer, in the absence of any constraints, would be the proportion that generates the optimal risk-adjusted reward, or Sharpe ratio. However, there are often some real-world constraints – investor preferences, lookback window, and tracking error – that come into play and may shrink a trend-following allocation. We investigate each of these in this paper.
Trend-Following with Long-Only Multi-Asset Portfolio
For most of the 21st century, 60/40 has been the hallmark of multi-asset investing, driven by the twin tailwinds of rising prices and negative correlation.
We are cognisant that a large proportion of investors’ portfolios typically comprise a long-only multi-asset (LOMA) allocation. The most common example is the 60/40 portfolio: 60% global equities and 40% global bonds, notionally allocated. There may be regional or slight differences in the ratio of stocks to bonds, but for the scope of this paper, we will focus on a global version.
For most of the 21st century, 60/40 has been the hallmark of multi-asset investing, driven by the twin tailwinds of rising bond and equity prices, while being negatively correlated with each other. However, as we illustrate in Figure 1, an excerpt from a previous paper, the correlation between bonds and equities has recently trickled into positive territory, a reversion to what was seemingly the status quo for most periods before the turn of the century.
Figure 1. Rolling 3Y Bond and Equity Correlation
Problems loading this infographic? - Please click here
Source: Bloomberg, Man Group Database. Date range: 1 January 1900 to 31 December 2023.
It may be that traditional portfolios need additional sources of diversification more than they have done in this century.
Thus, it may be that traditional portfolios, such as 60/40, need additional sources of diversification more than they have done in this century. Trend-following, we believe, fits the bill nicely, but how much do investors need?
In Figure 2 we analyse the optimal combination, as defined by Sharpe ratio, of trend-following, proxied by the BTOP50 Index, and 60/40, proxied by 60% MSCI World USD Hedged Index and 40% Bloomberg Global Aggregate USD Hedged Index, through time. The different points on the x-axis of the chart refer to the different lookback windows used when ascertaining the optimal combination but all running through to December 2023. For example, the point in January 1995 computes the optimal combination using a start date of January 1995 up to December 2023, whereas a point in January 2015 determines the optimal combination using data from that point up until December 2023.
Figure 2. Optimal Combination of 60/40 and Trend-Following Using Sharpe Ratio, with Different Lookback Windows (x-axis represents starting dates) to December 2023
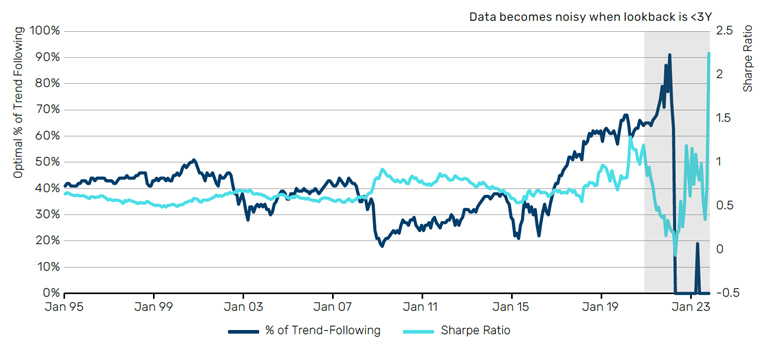
Source: Bloomberg, Backstop Solutions Group, LLC – BarclayHedge (www.barclayhedge.com), Man Group, as of 31 December 2023.
The swings of the optimal percentage of trend-following (dark blue) curve in Figure 2 illustrate its strongly time-varying nature. With that said, these oscillations are relatively intuitive. Trend-following has a relatively higher optimal weight in the early period of the sample given its outperformance, and on a relatively lower level of volatility, throughout the dot-com bubble burst and the Global Financial Crisis (GFC), periods where traditional assets struggled. However, following the GFC, trend-following entered what many regard as the ‘CTA winter’, where returns were broadly flat, which leads to a drop in optimal weight. From 2022 onwards, the ratio oscillates wildly given stark performance differences between trend-following (+14.9%) and 60/40 (-13.5%) during 2022’s inflationary burst.
To most credibly determine the optimal combination, and to overcome the outsized effect of ‘noise’, statistics suggest that we should refer to the longest sample available. Looking at the full sample, this indicates an optimal 40% allocation to trend-following and 60% to 60/40.
We do, however, appreciate that ‘optimal’ is in the eye of the beholder. Some investors, such as those who are expressly interested in trend-following’s defensiveness may consider drawdown to be the most pertinent measure of optimal.
In Figure 3 we plot the percentage of trend-following (when combined with 60/40) that yields the smallest maximum drawdown. Trend-following’s positive return skew, which we discuss in greater detail in this paper, means its drawdowns are relatively muted through time, leading it to have a relatively higher weight when optimising for the lowest maximum drawdown. Again, looking at the full sample from January 1995 to December 2023 indicates the optimal percentage of trend-following to yield the lowest maximum drawdown when combined with 60/40 is 63%.
Figure 3. Optimal Combination of 60/40 and Trend-Following through Using Max Drawdown with Different Lookback Windows (x-axis represents starting dates) to December 2023
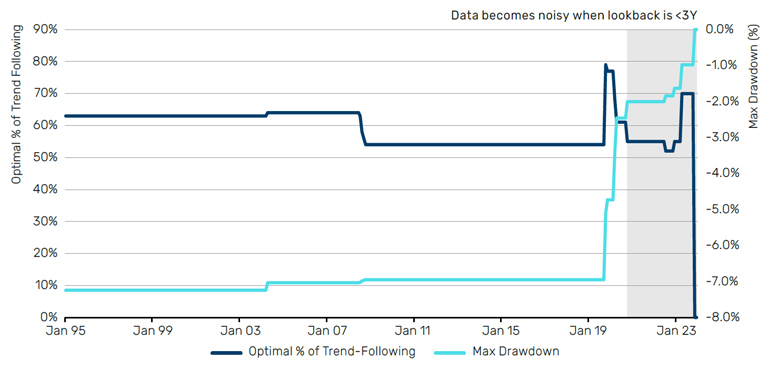
Source: Bloomberg, Backstop Solutions Group, LLC – BarclayHedge (www.barclayhedge.com), Man Group, as of 31 December 2023.
Tracking in the Right (Or Wrong) Direction?
Trend-following’s convexity means that this tracking error to 60/40 is generally at its greatest when we need it most, in other words, when 60/40 is at its worst.
Admittedly, an investor or allocator looking at the aforementioned optimal figures may be gawking at the sizes of the proposed trend-following allocations. And there is some justification in that reaction.
While trend-following is an active, absolute return strategy and therefore not managed to a benchmark, 60/40 or equities are the industry gold standard for performance evaluation. There is some merit to this. Equities, and by association, 60/40, have been one of the best performing asset classes of the last 20 years, earning it the TINA – ‘There is No Alternative’ – title. Therefore, the risk of underperforming (i.e., downside tracking error) equities or a 60/40 for a sustained period invites challenging questions from clients and investment committees and is therefore a real-world constraint to consider when designing asset allocations.
However, trend-following’s convexity means that this tracking error to 60/40 is generally at its greatest when we need it most, in other words, when 60/40 is at its worst. In Figure 4, we plot the rolling 12-month tracking error of a 100% trend-following portfolio and the Sharpe-optimal combination (40% Trend and 60% 60/40) to 60/40. The spikes in the tracking error curves are contemporaneous to drawdowns for 60/40, while the curves taper towards their lows when 60/40 rallies.
Figure 4. Rolling 1Y Annualised Tracking Error between Trend-Following and 60/40
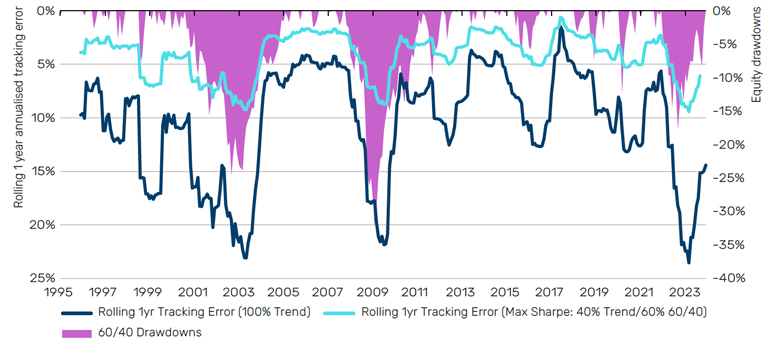
Source: Bloomberg, Backstop Solutions Group, LLC – BarclayHedge (www.barclayhedge.com), Man Group, as of 31 December 2023.
If It Moves, Monetise It!
The cash efficiency of instruments traded by trend-following strategies means that little additional cash is needed to fund an allocation.
The point of this paper is not to say investors should significantly down weight the LOMA component of their portfolio and replace it with trend-following. Equities and bonds have accrued significant historical gains, and justifiably make up a meaningful portion of strategic asset allocations. As discussed in ‘Trend-Following: If it Moves, Monetise It!’, the cash efficiency of instruments traded by trend-following strategies means that little additional cash is needed to fund an allocation.
Let us take the following example. Allocating 90% of cash to the LOMA and 10% to trend-following, with the latter levered up by 4x, leads to roughly 40% trend-following, 90% LOMA, or 30% trend-following and 70% LOMA in normalised notional allocation terms. See Solution 1 in Figure 5. But this is just one of many implementation options. Another approach, that preserves 100% of the LOMA, would be to replicate the LOMA using a swap or futures, with the cash-efficiency creating excess cash to allocate to the trend-following component – Solution 2 in Figure 5. Both options also facilitate customisation in terms of the amount of leverage desired.
Figure 5. Cash-Efficient Implementations of 60/40 and Trend-Following
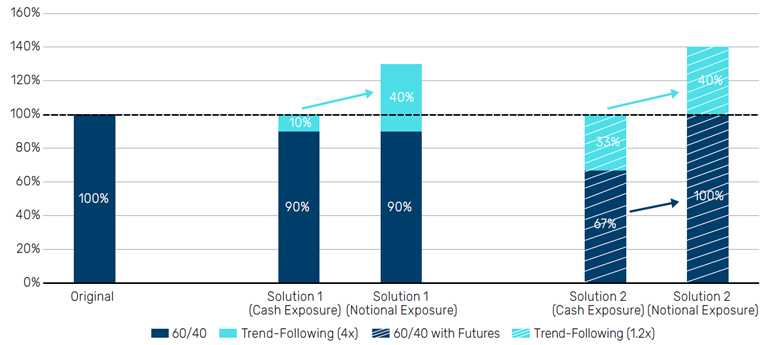
Source: Man Group, as of 31 December 2023. Number in brackets represents leverage on trend-following allocation.
Account curves and drawdown profiles of these three potential solutions are illustrated in Figure 6. Note how Solution 2, with the same amount of 60/40 as our original 60/40 portfolio, enhances the return of 60/40 by 2.3% per annum on similar volatility and drawdown.
Figure 6. Account Curves of Combinations of Solutions Presented in Figure 5
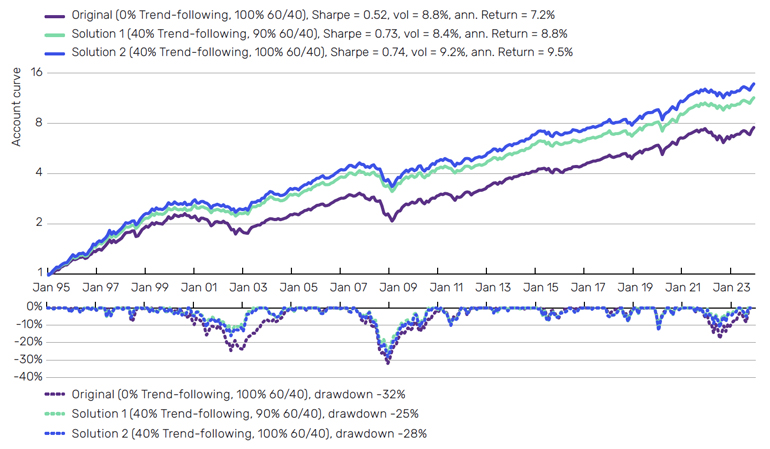
Source: Bloomberg, Backstop Solutions Group, LLC – BarclayHedge (www.barclayhedge.com), Man Group. Trend-following represented by BTOP50. Date range: 1 January 1995 to 31 December 2023.
Concluding Thoughts
Aside from its desirable crisis alpha and riskmanagement properties, trend-following generates attractive longterm risk-adjusted returns while being diversified to traditional assets.
Real-world constraints often predicate that trend-following may not get the allocations our two measures of optimal, namely Sharpe ratio and drawdown mitigation, might suggest. And we are not advocating that it should either. Instead, we hope the takeaway of this paper is that investors and allocators give trend-following serious consideration for inclusion in portfolios in more meaningful quantities than it historically has been. Aside from its desirable crisis alpha and risk-management properties, it generates attractive long-term risk-adjusted returns while being diversified to traditional assets. Cash efficiency also means that it need not precipitate abandoning a traditional LOMA approach to accommodate more trend-following, but instead combined in a robust framework that uses leverage to monetise the diversification.
Bibliography
Panjabi, Y, Robertson, G. (2023), “Trend-Following and Long/Short Quality: Attack Wins You Games, Defence Wins You Titles”, Man Institute, Available at: www.man.com/maninstitute/trend-following-long-short-quality-attack-wins
Robertson, G. (2023), “Trend-Following: If it Moves, Monetise it!”, Man Institute, Available at: www.man.com/maninstitute/trend-following-if-it-moves-monetise
Robertson, G, Goodall, R. (2023) “What’s Trending: A Different Point of Skew”, Man Institute, Available at: www.man.com/maninstitute/trend-following-different-point-skew
Robertson, G, (2023) “What’s Trending: Trend-following – What’s Not to Like?”, Man Institute, Available at: www.man.com/maninstitute/trend-following-what-not-to-like
You are now leaving Man Group’s website
You are leaving Man Group’s website and entering a third-party website that is not controlled, maintained, or monitored by Man Group. Man Group is not responsible for the content or availability of the third-party website. By leaving Man Group’s website, you will be subject to the third-party website’s terms, policies and/or notices, including those related to privacy and security, as applicable.