‘Attack wins you games, defence wins you titles’. Those are the words of Sir Alex Ferguson, arguably British football’s most accomplished coach, whose 13 Premier League trophies were embodied by an impeccable and resolute defensive line. This defensive philosophy is equally applicable to the arena of asset management and offers a robust principle for portfolio construction. In this paper, we explore how a long/ short (L/S) quality cash equity strategy has similar defensive characteristics to trend-following, but achieves this by a differentiated yet complementary approach.
Introduction
In a previous article, Trend Following: A Different Point of Skew, we observed that the ‘crisis alpha’ provided by trend-following strategies depends on the period over which we are seeking protection. When sell-offs last longer than a few months, which is the typical sensitivity of trend-followers, strategies have time to react. Over relatively short periods, say one week, trend-following does not have enough time to adapt, and the ‘crisis alpha’ property disappears. This naturally leads us to ask: how can we protect ourselves against sharper, faster sell-offs? Or, better yet, how can we profit from them?
To answer this, we turn to the insights shared by our Man Group colleagues in ‘The Best of Strategies for the Worst of Times: Can Portfolios Be Crisis Proofed?’, by exploring how a L/S quality cash equity strategy can be a diversifying complement to trend-following whilst also sharing its defensive characteristics.
Underpinnings of Quality
In reality, the price of quality fluctuates through time and the quality premium is often lower when markets are more richly valued.
Higher quality = higher price. This is a generally accepted principle when shopping just about anywhere, and Asness, Frazzini and Pedersen (2019) suggest that it should also hold in capital markets; investors should be willing to pay higher prices for quality stocks. However, in reality, the price of quality fluctuates through time and the quality premium is often lower when markets are more richly valued, typically after a sustained period of positive performance for stocks.
When stocks suddenly (or eventually) sell off, however, quality stocks often benefit from a ‘flight-to-quality’ effect. Intuitively, the price dynamics of a flight-to-quality event run counter to a traditional risky asset portfolio such as a long only stocks portfolio, as money flows into stable or safe-haven assets.
Proponents of the ‘60/40’ portfolio – 60% allocated to equities, 40% to bonds – may argue that the bond allocation mitigates the flight-to-quality impact on stocks, as bonds typically perform well during these events. This rationale failed completely in 2022, however, as bonds and equities sold off simultaneously on an inflation spike. As Figure 1 illustrates, investors were potentially lulled into a false sense of security as the negative bond/equity correlation is a market phenomenon of only the last two decades.
We therefore seek a dynamic strategy that can provide more robust protection against a flight-to-quality over the long-term. Naturally, this leads us to think of the convex properties of trend-following.
Figure 1. Rolling 3-Year Bond and Equity Correlation
Problems loading this infographic? - Please click here
Source: Bloomberg, Man Group database. Date range: 31 January 1900 to 30 September 2023.
Would an allocation to L/S quality have helped in March 2023 or help defend against short, sharp reversals more broadly over time?
Trend-following’s defensiveness was found wanting in March 2023. Silicon Valley Bank’s collapse triggered a ‘flight-to-quality’ effect, which ran counter to the prevailing trends – and therefore trend-following’s positioning – of equities up, bonds down (see Trend Following: Movin’ On Up ). On the other hand, this ‘flight to quality’ would seem to be tailor-made for a L/S quality strategy; would an allocation to L/S quality have helped in March 2023 or help defend against short, sharp reversals more broadly over time?
Turning Defence into Offense
Intuitively, we can understand the defensive nature of a L/S quality strategy. If we represent L/S quality as AQR’s Quality-Minus-Junk ‘QMJ’ Global portfolio, we see that it has a positive return in the long-term, as does trend-following, represented by the Société Générale (SG) Trend Index (Table 1). We use QMJ as an alternative to the US-centric data in ‘The Best of Strategies for the Worst of Times: Can Portfolios Be Crisis Proofed?’, but note, as the authors rightly point out, that QMJ’s dollar-neutral construction mechanically yields a negative equity beta as a result of being long lower beta stocks and short higher beta stocks. However, the long-term risk and return characteristics are broadly similar to the dataset referenced in the paper. We now delve into their complementarity.
Table 1. Statistics for L/S Quality (QMJ Global) and Trend-Following (SG Trend Index)
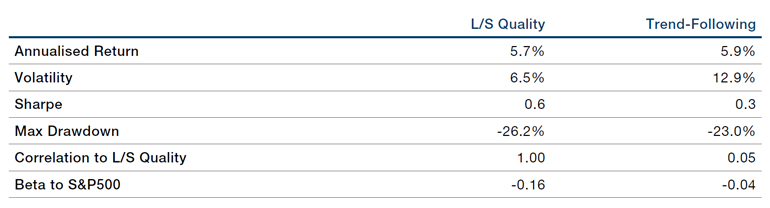
Source: AQR Capital Management, Société Generale, Bloomberg. AQR Quality-Minus-Junk ‘QMJ’ Global portfolio dataset available here: https://www.aqr.com/Insights/Datasets?&page=2#filtered-list. Date range: 1 January 2000 to 30 June 2023. Past performance does not guarantee future results. Please see the important information linked at the end of this document for additional information on hypothetical results.
To verify L/S quality’s credentials alongside trend-following, we look at how the strategy performs during strong trend reversals (which serve as a proxy for market reversals). To do this, we take the 10 worst distinct rolling five-day returns for the SG Trend Index since January 2000, as we do in Trend Following: Movin’ On Up.
Figure 2. Performance of L/S Quality versus the 10 Worst Rolling Five-Day Periods for Trend-Following. World Stocks Performance Represented by Numeric Labels
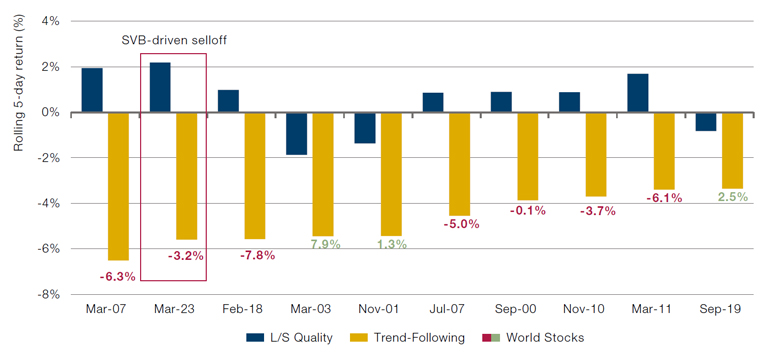
Source: AQR Capital Management, Société Générale and Bloomberg; between 1 January 2000 to 30 June 2023. L/S Quality represented by QMJ Global Daily Returns. Trend-following represented by SG Trend Index. World Stocks represented by MSCI World Total Return Index. Trend-following returns are ex-post volatility scaled to equivalent volatility of L/S Quality. The dates selected are exceptional and the results do not reflect typical performance.
In seven out of the 10 instances, L/S quality returns are positive in these reversal events. In the other three instances, L/S quality loses less than trend-following.
In seven out of the 10 instances, L/S quality returns are positive in these reversal events. In the other three instances, L/S quality loses less than trend-following. It would seem that our expectations of the complementarity of L/S quality and trend-following strategies during sudden market reversals holds true. What is interesting, though, is that in all three of these periods where L/S quality is negative, the performance of world stocks is positive (represented by the red and green numeric labels on the chart). This suggests that the driver of these trend-following reversals is a risk-on market move, i.e. the opposite of a flight-to-quality effect, which inflicts losses to trend-following’s negative stock delta positioning. As such, we can reasonably conclude that L/S quality credentials during a flight-to-quality driven trend-following reversal remain untarnished throughout the surveyed period.
The attractiveness of the pairing does not end there. Figure 3 shows the performance of L/S quality during trend-following’s eight largest distinct drawdown periods between 1 January 2000 and 30 June 2023. It clearly illustrates that L/S quality strategies work well when trend-following is in drawdown too.
Figure 3. Performance of L/S Quality During Trend-Following’s Largest Drawdowns
Problems loading this infographic? - Please click here
Source: AQR Capital Management, Société Générale and Bloomberg; between 1 January 2000 to 30 June 2023. L/S Quality represented by QMJ Global Daily Returns. Trend-following represented by SG Trend Index. Trend-following returns are ex-post volatility scaled to equivalent volatility of L/S Quality. The periods selected are exceptional and the results do not reflect typical performance. Past performance does not guarantee future results.
Table 2. Statistics for L/S Quality (QMJ Global) and Trend-Following (SG Trend Index) Drawdowns
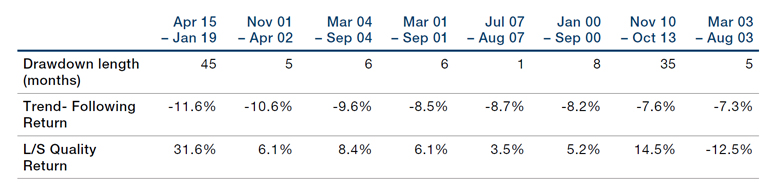
Source: AQR Capital Management, Société Générale. Date range: 1 January 2000 to 30 June 2023. The periods selected are exceptional and the results do not reflect typical performance. Past performance does not guarantee future results.
Readers of ‘Trend-Following: If it Moves, Monetise It!’ may recall that two of the drawdowns in Figure 3 / Table 2 constitute the so-called ‘CTA winter’ between 2009 and 2019. Notably, compared to trend-following, we observe L/S quality outperforms by approximately 40% between April 2015 and January 2019, and by around 25% between November 2010 and October 20131.
This underscores the diversification provided by the quality strategy, identifying itself as a robust defensive alternative that is complementary to trend-following over both short and longer investment horizons.
Concluding Thoughts
L/S quality captures the ‘flight-to-quality’ effect that occurs around trend reversals, not just outperforming trend-following losses, but delivering positive returns.
Risk management is arguably one of the most crucial aspects in the arena of asset management. At the heart of risk management lies the challenge to both protect a portfolio during the bad times, while also optimising it during the good. Trend-following’s convexity and skewness characteristics have positioned it as an attractive liquid defensive strategy, delivering crisis alpha when traditional assets sell-off, while attaining broadly comparable returns to stocks over the long term. However, as we saw in March, these characteristics may not hold over very short horizons, which is particularly painful when markets or trends reverse sharply. While trend-following tends to recoup losses within six to 12 months following a reversal, as shown in Trend Following: Movin’ On Up, we want to mitigate these reversals altogether, leading us to ask the two questions we posed at the start of this piece: how can we protect ourselves against sharper, faster sell-offs? And how can we profit from them?
As we have shown, we believe one answer is a L/S quality strategy; it captures the ‘flight-to-quality’ effect that occurs around trend reversals, not just outperforming trend-following losses, but delivering positive returns. This evidence persists even over longer trend-following drawdown periods, such as in the CTA winter – demonstrating the true value of defence.
Like any great coach, when we stumble upon a seemingly dynamic duo, each with a complementary skill set, we would be unwise not to capitalise on it, particularly when this duo does not come at much of a cost – given the low correlation and potentially attractive annualised return.
We shall explore the combination of L/S quality and trend-following in more detail in our next note.
Bibliography
Asness, C, S, Frazzini, A, Pedersen, L, H. (2019), ‘Quality Minus Junk’, Review of Accounting Studies, 24(1), pp. 34–112. doi:10.1007/s11142-018-9470-2.
Goodall, R. (2023), “Trend-Following: Movin’ on up”,Man Institute, Available at: https://www.man.com/maninstitute/trend-following-moving-on-up
Robertson, G. (2023), “Trend-Following: If it Moves, Monetise it!”,Man Institute, Available at: https://www.man.com/maninstitute/trend-following-if-it-moves-monetise
Robertson, G, Goodall, R. (2023). “Trend Following: A different point of skew”, Man Institute, Available at: https://www.man.com/maninstitute/trend-followingdifferent-point-skew
Harvey, C, R, Hoyle, E, Sargaison, M, Taylor, D, van Hemert, O. (2019), “The Best of Strategies for the Worst of Times: Can portfolios be crisis proofed”, Man Institute, Available at: https://www.man.com/maninstitute/best-of-strategies-for-the-worstof-times
1. Source: AQR Capital Management, Société Générale.
You are now leaving Man Group’s website
You are leaving Man Group’s website and entering a third-party website that is not controlled, maintained, or monitored by Man Group. Man Group is not responsible for the content or availability of the third-party website. By leaving Man Group’s website, you will be subject to the third-party website’s terms, policies and/or notices, including those related to privacy and security, as applicable.