I keep six honest serving-men (They taught me all I knew);
Their names are What and Why and When
And How and Where and Who.
I send them over land and sea,
I send them east and west;
But after they have worked for me,
I give them all a rest.
…
But different folk have different views;
I know a person small—
She keeps ten million serving-men,
Who get no rest at all.
She sends ‘em abroad on her own affairs,
From the second she opens her eyes—
One million Hows, two million Wheres,
And seven million Whys!
– Rudyard Kipling, “The Elephant’s Child” (1900)
Introduction
Questions are at the heart of investment management. Yet few investors have capacity to ask more than a handful of differentiated market questions each day, let alone answer them. Those who claim to do more are probably lying. But perhaps the god is about to come out of the machine and, per the analogue of Kipling’s poem, we are on the cusp of being able to unleash question-armies of millions onto our investment landscapes.
It is within this context that we recently turned our attention to what ChatGPT ‘thinks’ about investment strategy. Broadly speaking, our investment framework involves two stages. First, to ascertain which inflation episode we are in within our Fire & Ice framework (Fire, disinflation, Ice or reflation). And second, within the allowable ranges of each of the four episodes, to determine what our asset allocation should be based on three lenses: valuation, growth and sentiment.
We thought we’d get ChatGPT to give us a hand with the latter stage of this process. For the sake of simplicity, we limit our line of enquiry to US equities. Via a series of prompts we push our AI interlocutor for a single favourite metric that encapsulates each of our three lenses. Below we give a summary of ChatGPT’s views on each. We then overlay the machine’s view with our own experience of appropriate transformations and lookbacks, and backtest its efficacy.
Valuation
ChatGPT: “If I had to choose only one [valuation metric], I would choose the forward price-to-earning (‘P/E’) ratio. The forward P/E ratio is based on the market’s expectations for the company’s future earnings performance, which is arguably more relevant than its past performance. As a general rule of thumb, a lower forward P/E ratio would indicate that a stock is relatively cheaper and potentially more attractive from a valuation perspective…[and vice versa].”
In Figure 1, we show the results of making buy and sell decisions for the S&P 500 Index (relative to US Treasuries) based on the level of the 12-month forward P/E multiple. The top panel shows the forward multiple for the S&P 500 with +/- 1.5 standard deviation (‘SD’) bands. The middle panel shows the signals generated if you were to sell equities when the P/E breached +1.5 SDs and vice versa. The bottom panel shows the performance results of a 50/50 equity/bond portfolio (blue) versus one which is 100% equities when the signal is ‘buy’, 100% bonds when it is ‘sell’ and 50/50 otherwise.
The bottom line needs little explanation. It doesn’t work. At best you could say it’s very early. In the DotCom bubble, for instance, this system gives its first sell signal in June 1996 and continues to say the same consistently right through to the market top at the turn of the century. So perhaps that’s far-sighted. Then again from June 1996 to the end of the century equities outperformed bonds by 78%. There comes a point when ‘right but really, really, early’ equals wrong. As a wise man once said, and so it seems, valuation alone is never enough.
Figure 1. S&P 500 12-Month Forward P/E (Top), Buy/Sell Signals Based on 1.5 SD Bands (Middle), and Performance of These Signals (Bottom)
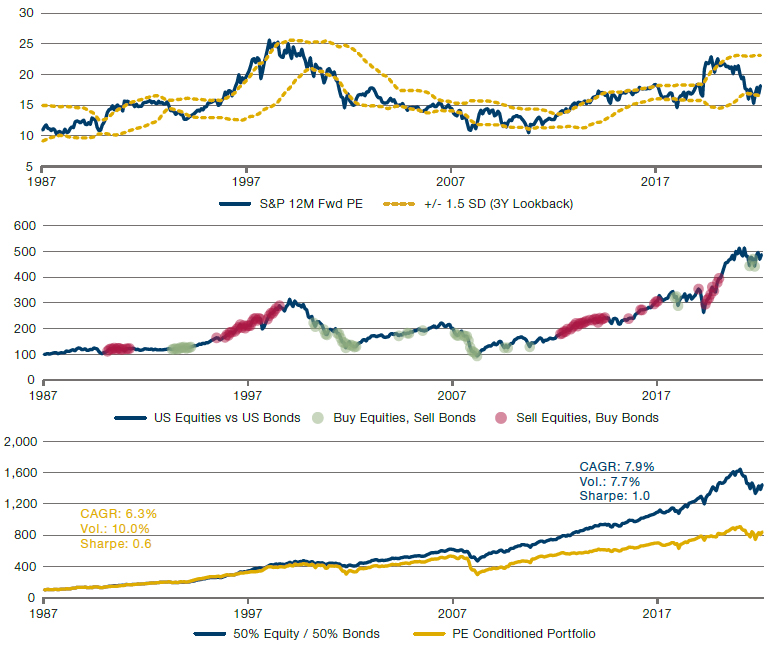
Source: Man DNA; as of 28 February 2023. All performance data from Bloomberg. Forward P/Es from IBES. US Equities are represented by the S&P 500. US Bonds are the Bloomberg Barclays US Treasury Aggregate. The P/E Conditioned portfolio goes to 100% equities when there is a BUY signal in the middle panel, to 100% bonds when there is a SELL signal, and otherwise defaults to the 50/50 portfolio. Please see the important information linked at the end of this document for additional information on hypothetical results.
Growth
ChatGPT: “If I had to choose only one metric to gauge economic activity in the US, I would choose the monthly nonfarm payrolls (‘NFPs’) report… The nonfarm payrolls report is closely watched by investors and economists as it provides insights into the health of the economy and the potential for future growth. A strong nonfarm payrolls report, indicating a large number of jobs added to the economy, can signal robust economic growth and could lead to higher stock prices…[and vice versa].”
In Figure 2 we perform a similar analysis as for Figure 1 but using the net change in NFPs as our signal, ChatGPT’s chosen to metric to get a gauge on US economic activity and growth. As with the forward P/E, using this model in isolation does not seem to be performance enhancing.
Figure 2. NFPs Monthly Change (Top), Buy/Sell Signals Based on 1.0 SD Bands (Middle), and Performance of These Signals (Bottom)
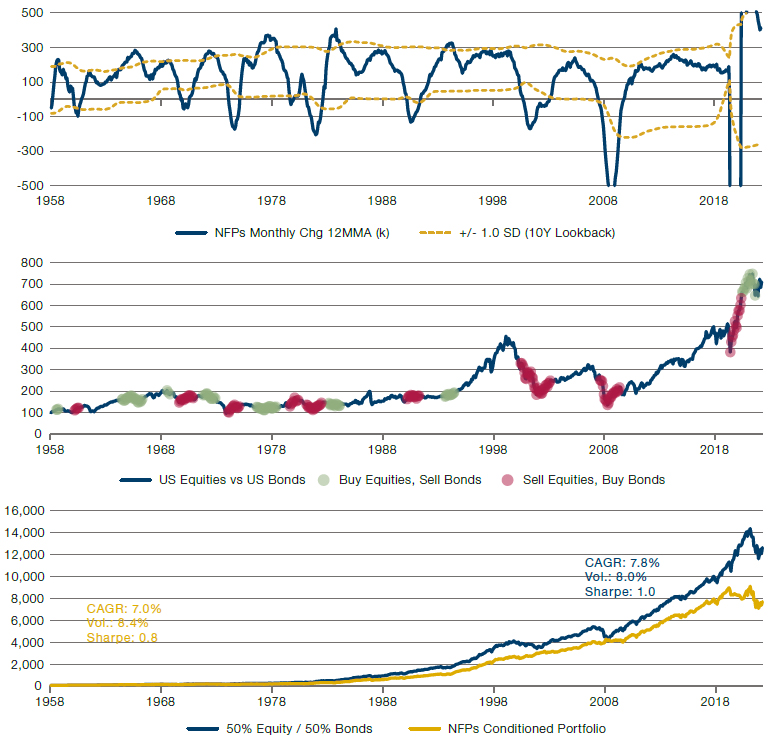
Source: Man DNA; as of 28 February 2023. All data from Bloomberg. Asset performance indices and methodology the same as for Figure 1, with the exception that, per ChatGPT’s recommendation, a move above +1 SD is BUY and vice versa. Please see the important information linked at the end of this document for additional information on hypothetical results.
Sentiment
ChatGPT: “If you’re only able to use one [sentiment] metric, which one you choose will depend on your investment objectives and risk tolerance. If you’re more concerned with short-term price movements and potential market shocks, implied volatility may be more useful. If you’re more focused on investor sentiment and the potential for longer-term trends in the stock market, equity fund flows may be a better choice…In general, it may be more attractive to buy equities when market sentiment is very negative, as this can lead to market oversold conditions…On the other hand, buying equities when market sentiment is very positive may be riskier, as the market may already be overbought and due for a correction.”
Finally, we turn to sentiment. Here, try as we might, we couldn’t squeeze a single answer out of the machine. Thus, in Figure 3, the top panel shows both VIX (implied volatility) as well as equity fund flows. Per ChatGPT’s suggestion that optimistic market sentiment is potentially bearish, in terms of generating the buy and sell signals we flip the sign for the two metrics. Thus while a high VIX level (market pricing a lot of volatility) will equate to ‘BUY’, a high flow into US equity funds (indicating that investors perceive conditions to be benign) will equate to ‘SELL’. Combining the two in this way (we simply take the average of the two z scores) yields the signals in the middle panel. The performance pattern is the same as for our first two indicators, namely, there’s not much in it.
Figure 3. Sentiment Gauges (Top), Buy/Sell Signals Based on 1.0 SD Combination Bands (Middle), and Performance of These Signals (Bottom)
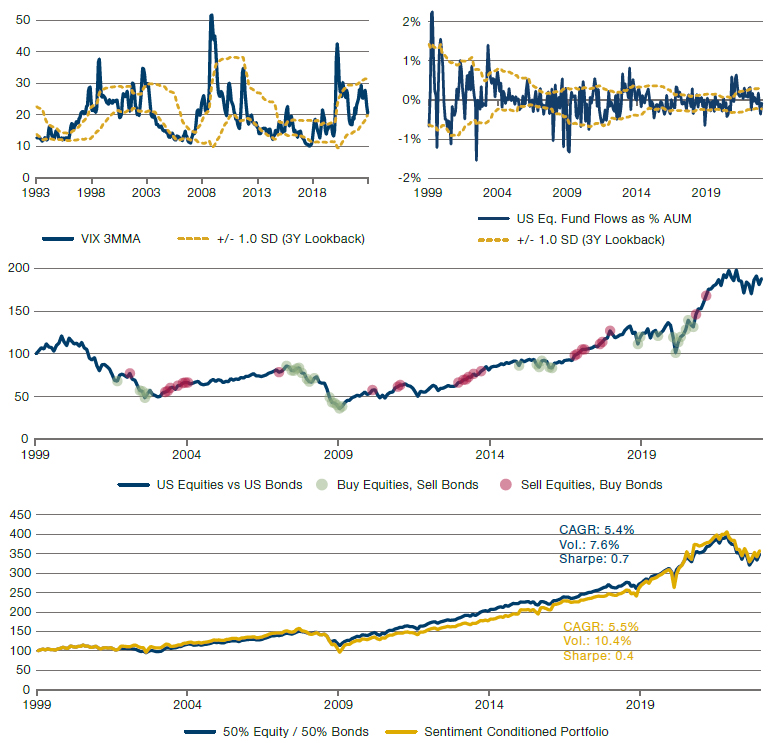
Source: Man DNA; as of 28 February 2023. All data from Bloomberg, except US fund flows which are derived from the EPFR dataset. Asset performance indices and methodology the same as for Figure 1, with the exception that, per ChatGPT’s recommendation, a move above +1 SD is BUY and vice versa. Please see the important information linked at the end of this document for additional information on hypothetical results.
Conclusion
‘Rubbish in, rubbish out’ is one of the first lessons most financial analysts are taught. This being the case, it should come as no surprise that when we combine these signals we get pretty weak aggregate buy and sell recommendations, as is illustrated in Figure 4.
Figure 4. Aggregate of Signals Coming out of Figures 1-3, with Performance of Equities vs Bonds
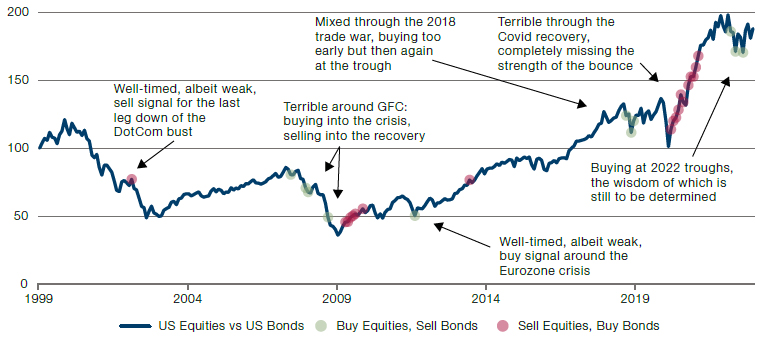
Source: Man DNA; as of 28 February 2023. Please see the important information linked at the end of this document for additional information on hypothetical results.
Now, far be it from us to be a Luddite smashing looms. Indeed, we think it is more than likely that AI systems like ChatGPT may have significant utility for investment managers in many areas of information gathering and processing. In fact, we would go further; we think they could well become as vital an analytical tool as Google Search did two decades earlier. But in the same way, our view is that its value will not be in telling you when and in what to invest, but rather to give you more information, more quickly, so as to make better (human) decisions.
So this missive is not an attack on ChatGPT, but a comment on the innate limitations of heuristics within investment management. It is so tempting to believe in a quantitatively clean answer; this valuation metric, this DCF methodology, etc. But our view is that, like the philosopher’s stone, while many will seek it, they shall all die doing so. Ours is not a game of Go or even something more complex; but one where the number of parameters is unknown, and their strength is ephemeral. A game which, therefore, requires an appreciation of shades of grey. So, for the time being at least, we believe our jobs as human investors – albeit ones heavily supported by machines – are safe. Then again, we say that with a good deal of humility. Many in history, when faced with the white heat of technology, have believed themselves to be walking a bright road ahead. When in fact it became, for them, a plank.

You are now leaving Man Group’s website
You are leaving Man Group’s website and entering a third-party website that is not controlled, maintained, or monitored by Man Group. Man Group is not responsible for the content or availability of the third-party website. By leaving Man Group’s website, you will be subject to the third-party website’s terms, policies and/or notices, including those related to privacy and security, as applicable.