Introduction
Before we start proper, a parish notice. We are delighted to have twisted the arm of Shamez Alibhai to co-author this edition of The Road Ahead with us. Shamez runs our community housing business, so we are very much in his bailiwick. Now to work.
While it is true that the general is warned against fighting his last war, and housing is perhaps not just the last war, but even the one before that, we do not overlook it. A house forms the majority of many people’s wealth and is thus a key metric to understand the health of the consumer. It is emotive. Politicians care about it. It moves stuff by implication even if not directly. Not to mention that housebuilders form a large equity segment in their own right, and are an investable opportunity.
So for all these reasons we care about property. But we rarely write about it; indeed we have barely a single metric covering it in our monthly Market Radar dashboard that some of you may receive. That is a sacrifice to brevity. But we thought it worth here putting down some of the ways we think about the space. We have limited our analysis to the UK, purely because the data are good and we know it relatively well. We could just as easily apply this methodology to the US or Australia. Sequels to come, perhaps.
House Prices
Are houses expensive? Taken as one homogenous national block, we think yes. The real sale price in 2022 was the highest ever, and history tells us that multi-year grinding bear markets can happen, contrary to recent experience. Affordability, measured as average mortgage costs as a percentage of net income, is at record unattractive levels. And, contrary to the headlines, there are actually quite a large number of houses being built, at least in aggregate and relative to recent household formation levels. The devil in the detail is that many of these houses are being built in the wrong places. Thus while the space in totality can look tired, in specific areas there is still acute opportunity to build more.
But let us begin with the bird’s eye view, and we will come to the details in time.
Even adjusting for inflation, the average UK house is more expensive than it has ever been. In 1900 the average house in the UK cost £370. In 2022 it was £285,396. Your grandmother has given you some version of this statistic. But, like the song says, just as politicians will philander, so prices will rise. Thus in Figure 1 we show the average price of a UK house in 2022 pounds.
Figure 1. Average UK House Sale in 2022 Pounds Sterling (1900-2022, Annual Data)
Problems loading this infographic? - Please click here
Source: Man DNA based on house-price data from UK Land Registry back to 1968 and Bank of England before that. Inflation data from Bank of England and ONS. As of 31 December 2022.
And the bottom line is the same as what your grandmother told you. 2022’s value of £285,396 is the highest ever, only rivalled by 2007 (£275,871). As a by-the-by, note that, taking the long historical perspective, there is nothing inevitable about the healthy returns to residential real estate that most of our readers will have experienced. Since 1971 the real CAGR has been +3.4%. From 1900-1971 it was +0.4%. Real house prices fell consistently for two decades at the start of the 20th century.
Affordability
The extent to which the average citizen can afford to buy a house is at all-time lows. Affordability is a function of house prices, mortgage rates (since very few people buy a house outright) and average income. In Figure 2 we use the house prices in Figure 1, average mortgage rates as reported by the Bank of England, and average household income from the ONS to compute the percentage of earnings devoted to mortgage payments.
The chart shows a step-change before and after 1980. In the first eight decades the average household spent about 4% of its income paying off housing debt. In the next four decades this increased to 16%, as house prices rose (per Figure 1). Though mortgage rates fell they did so slowly, and from a high base, while income growth was positive but anaemic.
Figure 2. Average Mortgage Payments as % of After-Tax Income (1900-2022, Annual Data)
Problems loading this infographic? - Please click here
Source: Man DNA based on: house prices per Fig. 1; mortgage costs calculated using mortgage rates from the Bank of England, and assuming a 35-year 75% LTV mortgage, divided by average household income as reported by the ONS and the Bank of England in the early part of the dataset. As of 31 December 2022.
The average person taking out a new mortgage in 2022 will be spending a quarter of their net income on mortgage payments. This is high even relative to the standard of recent years. In absolute terms this translates to average monthly post-tax household income of £3,507 and mortgage payments of £864. For context, estimates from British Gas suggest average electricity and gas bills ran at £208 per month through 2022.1 Food costs for an average family of four were £771.2 So arguably we might not be at unaffordable levels yet in absolute terms. But equally, as what is the biggest single line item for most families, it has an acute sensitivity, and further rate rises will take us into unchartered territory. The final data point in Figure 2 uses a mortgage rate of 3.4% (the average across 2022). In 2023 so far this is 4.4%, implying an additional £124 of mortgage costs, all things equal.3
As a by-the-by, we think this is a good demonstration of why monetary policymakers, both in the UK and more widely, are very unlikely to be able to prevent further inflationary waves this decade.4 As discussed in an earlier note5, we still like the Taylor Rule as a good heuristic for the required rate to end inflationary pressure for good. For the UK today this is 12.8%. Over the long term the average spread between mortgage rates and Bank of England base has been 120 basis points. Mortgage rates of 14% would equate to £2,374 per month for the average household, or 68% of income.6 We feel confident in saying it ain’t happening.
Housing Supply
This sensitivity puts a lot of pressure on authorities to do something – the obvious something being to facilitate more construction. For all the headlines about Britain’s chronic nimbyism the data are more encouraging, at least in aggregate. Over the past 10 years average household formation for the UK has been 154,000 per annum (ranging from 43,000 in 2013 to 350,000 in 2018). The government’s latest data show more than 243,000 dwellings being completed for England alone in the year to June 2022.7
And it is not like we are using the existing housing stock particularly intensively. Today the average UK dwelling has 2.4 residents. In 1900 this figure was 4.8.8 So we have halved the number of people per household. We grow lonelier. But the extent to which, as a society, we can get much more isolationist in our personal relationships is, in our view, limited.
Now this having been said, it must be acknowledged that household formation is a closed loop, so supply affects demand and vice versa. It is therefore possible that there is pent-up demand from those who would like to form a new household, but cannot because restricted available supply is out of their price range.This brings us to an important point. An average covers a multitude of sins, and while the aggregate numbers tell one story, in some areas of the UK the reality is starkly different. In Figure 3, we show the extent to which individual regions are meeting their housing targets. While the majority of England is hitting the mark, there are sizeable pockets where this is not the case.
Figure 3. Average Annual Delivery of New Homes for the Five Years to 2021 as a Proportion of Annual Housing Need
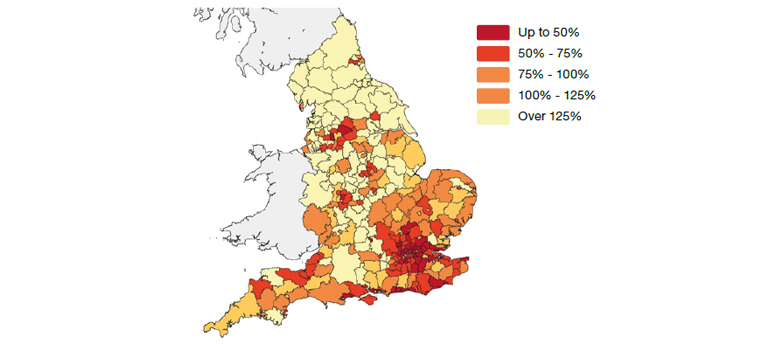
Source: Savills Research based on data from the ONS and DLUHC; as of 31 December 2021.
Conclusion
All of which is to say that while we think there are specific (and rewarding) opportunities within the space, we see UK housing as a naïve beta as unwise. Even in the best of times it is debateable whether housing is a better investment than the alternatives. In Figure 4 we show the 10-year annualised real return to UK equities and residential real estate. 71% of the time equities outperform, and by an average of three percentage points. And this is before the maintenance cost and general hassle that owning a house brings with it. Today UK equities trade at less than 11 times forward earnings.9 That is around the 25th percentile of historic valuations. Meanwhile all the metrics we have discussed suggest housing, in aggregate, is expensive. We don’t think this is an argument to jettison the space altogether, but rather to be more active in targeting specific geographic and demographic needs. Housebuilders are often told to be more sensitive to local peculiarities and not roll out a nationwide cookie-cutter. We believe investors should do likewise.
Figure 4. 10-Year Trailing Real Returns to UK Housing and Equities (1910-2022, Annual Data)
Problems loading this infographic? - Please click here
Source: Man DNA calculations using data from the Bank of England, ONS (see footnote to Fig.1) and GFD; as of 31 December 2022.
1. www.moneyhelper.org.uk/en/blog/utilities/how-much-is-the-average-gas-and-electricity-bill-per-month#:~:text=What’s%20the%20average%20electricity%20 bill,year%2C%20or%20%C2%A396.36%20per
2. www.nimblefins.co.uk/average-uk-household-cost-food#:~:text=The%20average%20spend%20on%20food,or%20 ordering%20takeaways%20each%20week
3. Source: Man DNA calculations based off mortgage rates reported by the Bank of England.
4. As discussed in an earlier edition, while we expect inflationary pressures to moderate in 2023, we then anticipate further waves of intensifying price pressures through the rest of the decade. See: www.man.com/maninstitute/road-ahead-lessons-from-1970s
5. See www.man.com/maninstitute/road-ahead-forgotten-rule
6. Calculated on the same basis as Fig. 2. Taylor Rule as calculated by Bloomberg. Average spread of mortgages over base rate reported by Bank of England.
7. www.gov.uk/government/statistics/housing-supplyindicators-of-new-supply-england-april-to-june-2022/housing-supply-indicators-of-new-supply-england-april-to-june-2022
8. Calculated by the Man DNA team based on UK census data.
9. Source: MSCI, Bloomberg; as of 31 December 2023.
You are now leaving Man Group’s website
You are leaving Man Group’s website and entering a third-party website that is not controlled, maintained, or monitored by Man Group. Man Group is not responsible for the content or availability of the third-party website. By leaving Man Group’s website, you will be subject to the third-party website’s terms, policies and/or notices, including those related to privacy and security, as applicable.