Key takeaways:
- India's GDP grows at double the rest of world’s rate and around 100 basis points faster than China's. It boasts a middle class expanding at light speed, huge capex programmes and appears well-positioned to benefit from the multipolar world switch
- And yet at the same time it is currently expensive, is probably cyclical, and is subject to political and geopolitical risk
- For me, this is one to hold and forget. You can’t ignore the hugely attractive long-term fundamentals, but you’ll definitely have to weather drawdowns along the way
For avid fans of Indian cricket, hopes that the team would win the series dampened this summer. The highest-rated Test team in the world underperformed expectations, finishing the recent Test match relieved to have drawn.
In recent years, for many investors considering Indian stocks, there has been a similar tendency towards excitability at the potential, which now appears somewhat unrealised.
The geography was regularly the top pick at start-of-year outlook conferences, more recently coupled with pronounced China pessimism. And, to state the obvious, those forecasts were wrong. As of 21 July, MSCI China is up 21% in dollar terms year to date, whereas India is up less than 5%. As you might have surmised from recent notes,1 I’ve been with the bullish consensus on this one, and I’m still a believer. But here’s an attempt to put down a framework, in genuinely moderate fashion, warts and all.
All
The Indian working-age population is growing more than in any other country and by a huge margin. Per Figure 1, over the past 10 years it has added 11 million people between the ages of 16-55, every year. That is more than three times second-placed Nigeria. While this will moderate in the next decade, the increment over second place will still be close to three million. Compare it with China and the projection is a mirror image, with India set to increase by six million annually, and China to lose five. By 2034, India will be the source of 21% of the world’s working age population.
Of course it is one thing to have people, and another to deploy them. But India does a good job in this regard, at least relative to other countries with fast working-age population growth. It has an adult literacy rate of 76%, versus 62% for Nigeria, 58% for Pakistan and 52% for Ethiopia.2 Even with this speed of population growth, the country has improved the standard of living at a decent clip, with an increase in GDP per capita annualising at 7.6% over the last two decades (to US$2,697 today), compared with -0.9% for Nigeria (to US$807) and +3.3% for Pakistan (to US$1,485).3 Morgan Stanley estimates that 34% of households are upper middle or high income, and that this will increase to 53% by 2031.
Figure 1: Absolute growth in working-age population
Problems loading this infographic? - Please click here
Source: United Nations. Working age defined as 15-55. Shows countries with the highest and lowest working age population growth, ranked out of 236. Data as of June 2025.
And this brings us to a second strand in the good news story. India’s middle class is already enormous. The same source estimates it at 378 million souls. And on that high base, the fundamentals for future growth are very promising. Higher education is exploding; the country has gone from producing seven million university graduates a year 10 years ago, to 10 million today, of which almost 35% are in STEM subjects (compared to around 20% in the UK and US).4
Moreover, there are broader social changes afoot. Female participation rates are rising, from 27% in 2018, to 33% today.5 The harrowing pattern of gender foeticide seems to be abating; the male-to-female birth ratio has dropped from 1.1 in 2011, to 1.07 today.6 The fertility rate has now fallen below replacement rates, a negative shift for the sluggish West, but given the absolute population dynamics already described above, this represents a boon for India in allowing it to expand discretionary spending. Historically, in other nations, this combination of female economic agency and fertility stabilisation has represented a pivot point in the expansion of the middle class. And that middle class is under-levered. The Bank for International Settlements estimates India’s household-debt-to-GDP ratio as a little under 20%, half the emerging market (EM) average of 40%, and less than a third of the developed market (DM) mean of 70%.
The capital picture has historically muddied the promising labour picture. But recent years have seen a big acceleration. Figure 2 shows central government capital expenditure as a percentage of GDP, doubling as a proportion of output from 2020 levels to today. And this is yet to show any sign of crowding out private sector investment, the annual growth rate of which has risen from an average of -2.2% between 2016-21, to a +15.3% mean in the five years since.
A key component of these efforts has been the digitisation of the Indian economy to overcome the inter-regional frictions and cumbersome paperwork that corporates have often got stuck in. Aadhaar – a biometric identification system – has issued more than 1.4 billion cards. From a standing start in 2016, UPI – a mobile payments platform – now registers 18.4 billion transactions a month. These schemes can be controversial (particularly the former, in relation to privacy concerns), but in my view they will likely be a profound lubricant of commerce.
Figure 2: Central government capex 12-month trailing, percentage of GDP
Problems loading this infographic? - Please click here
Source: CMIE, Morgan Stanley Research, as of May 2025.
And then there’s the more tactical catalyst of friendshoring. As just one example, consider that it already costs Apple 8% more to make an iPhone in China than in India.7 While the pieces are still in flux – and sometimes fluctuating intraday – it seems likely to me that the tariff differential between China and India will be at least 8% lower for India than China. So even before we see the efficiencies discussed above bearing fruit, there is an economic case to be made to move production. And indeed, that is what we see in the data, with Morgan Stanley estimating that 20% of Apple’s production is now India based, up from 7% two years ago.
Warts
One of the early things an India bear will tell you is that it’s expensive. And indeed, on a simplistic screen, it is. At time of writing, the geography trades on a price-to-earnings (P/E) multiple of 24.6x and a price-to-book (P/B) of 3.6x.8 Regarding the former, of all MSCI geographies, this is bettered only by the US (24.8x), and for the latter only by the US (5.0x) and Switzerland (3.7x). Even if you do the whole ‘conditioning for return on equity’ canard, it looks pricey. India returns 15.2% on its equity capital, in aggregate, an admittedly high number (in fact second only to the US on 19.2%), but on a cross-sectional regional basis, a linear line of best fit would imply a P/B ratio around 1.3 turns lower.
I’m well versed in the limitations around valuation and market timing, but I am a believer in its value (too obvious?) for giving a long-term base rate assumption. And that’s what Figure 3 shows. Knowing nothing, from these levels (India at a five point P/E premium) you expect annual underperformance of an estimated 150 basis points (bps) versus the rest of the world, over the next decade.
Figure 3: Relationship between India valuation premium/discount and future out/underperformance
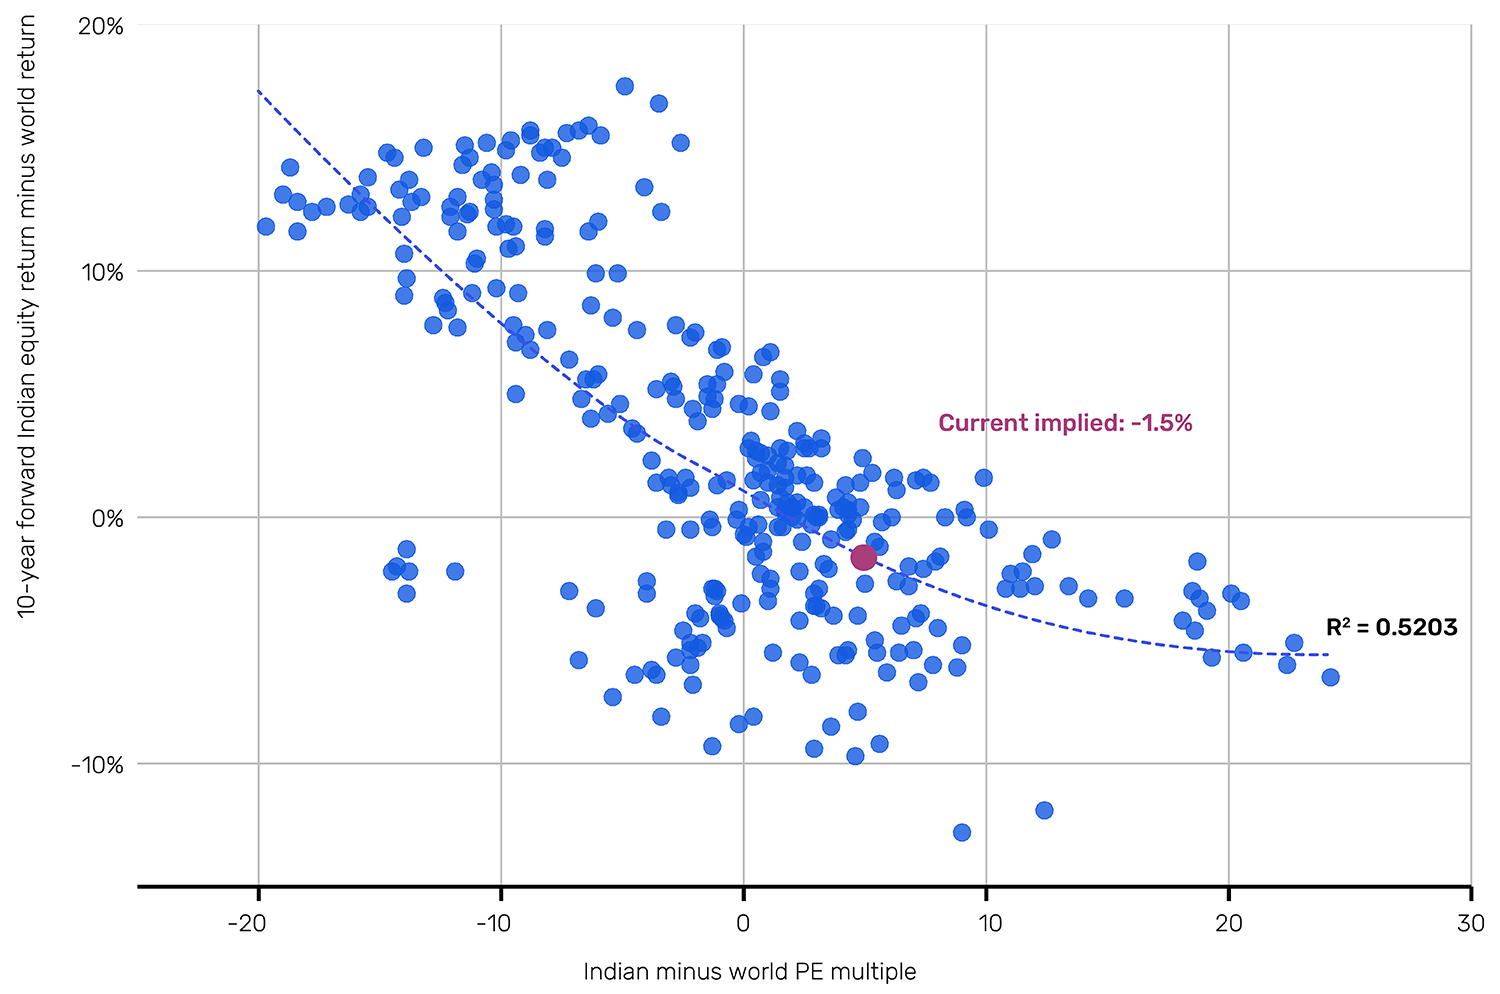
Source: GFD, Bloomberg, Man Group calculations. Data is from 1987 to June 2025.
And looking at the individual points of Figure 3, the skew is very much to the downside. At this level of valuation premium, the best you’ve got historically is +240bps per annum. The worst was -970bps. You do have to believe in a paradigmatic shift to overlook this. I do. In my view, the next 10 years will see the world’s ageing crisis story being thrown into ever sharper resolution, and with that contrast, India’s good-news demographics are going to push their way to the front of the market mind.
Over and above which, the burgeoning middle class earlier discussed is not just a positive in terms of jacking consumption, but also provides a big domestic bid for the home market. Stocks account for somewhere between 6-8% of the Indian household balance sheet. Gold is 15%. Bank deposits are 13%. Physical cash is 3%.9 The middle class buy stocks. The stock market is occupying more and more space in the public consciousness on the ground. Ask Jane Street. While such stories may turn people off in the short term, from a structural perspective, all publicity is good publicity.
The flows picture is also positive from an international point of view, as shown in Figure 4. At the start of the decade, India was less than 9% of MSCI EM, and China was 34%. More than 15 points have been shaved from this spread to date, and the consequent rebalancing flows have the potential to feed off themselves.
Figure 4: India and China as a percentage of EM
Problems loading this infographic? - Please click here
Source: MSCI, Bloomberg, Man Group calculations, as of June 2025.
Largely outside of its control, but the region is probably a loser in a global cyclical downturn. Italicised because, if you look at prior big equity sell-offs, it’s not clear cut by any means. Figure 5 shows the last 15 instances where the S&P fell 10% or more (the navy blue dots). Against this is shown (in aqua blue) the performance of MSCI India in local terms, and in pink the FX return over the same period. You can argue the toss, but if I did the same chart for a vol. selling strategy, for instance, the traffic would be more one way.
Figure 5: Performance in last 15 10% S&P drawdowns
Problems loading this infographic? - Please click here
Source: Bloomberg, Man Group calculations. Rupee performance is against USD.
Another angle to the global macro picture is India’s energy dependency, particularly in relation to oil, where imports account for 85% of its usage. If it kicks off à la 2022 then, given as I’ve described previously, oil and gas capex has been meagre, the cost per barrel response could be quite dynamic. While this tallies with intuition, it’s worth pointing out that it’s not really supported in the data. The correlation between crude and Indian equity outperformance over the long term is +0.2.10 Even in the more recent period of heightened oil volatility, this has not been meaningfully different, clocking in at +0.1 decade-to-date. Moreover, the country’s renewable energy capacity has been, and is set to continue to grow, at quite a clip. Over the next five years, 13D Research estimates that electrical generation capacity of nuclear will rise by 50% (13,080 megawatts to 19,680), wind +67% (72,896 MW to 121,895) and solar +96% (185,566 MW to 364,566). So this beta, if it even exists, is likely to lessen.
And then there’s the geopolitics, both international, in terms of its border tensions with China and Pakistan, and domestic in the Bharatiya Janata Party’s (BJP) flirtation with authoritarianism. These are very real risks from an investor’s perspective (and indeed other perspectives as well). Stock markets don’t like war. Stock markets do like democracy. Or rather the lack thereof can spark concerns that corporates will be victim to the whims of unpredictable central control. So further crystallisation of either of these, and the Nifty Fifty heads south, in my view. Frankly, there’s less I can say here in terms of alleviation. Either the ointment’s good enough for you to ignore the fly, or it isn’t. For me, it is. One small rebuttal of the latter is that, while the BJP didn’t lose the last election, they performed poorly, giving up their overall majority. If you’re a real authoritarian that doesn’t happen to you. And 642 million people voted. So there’s a franchise, to put it mildly.
In sum, there are concerns, there often are in this shades-of-grey business of ours. But I reckon this is not one to overthink. India’s stable growth rate is around double the world’s and perhaps 100bps above China. On a massive base. With a rapidly expanding middle class. And a centrally endorsed capex and digitisation programme. In a democratic format. In a world where being cheap and not being China is geostrategically useful for the West. Go Occum's Razor that. But as I said before, this is a long-term trade, which will have drawdowns. It is not the place for immoderate eyes on short-term gain. The Indian cricket team may have drawn with England on Sunday. However, according to CricViz, a cricket data and analytics provider, they resurged from an earlier 84% probability of losing.
1. See: https://www.man.com/insights/road-ahead-10-for-10-part-2
2. Source: https://worldpopulationreview.com/country-rankings/literacy-rate-by-cou…
3. Source: World Bank.
4. Source: Morgan Stanley.
5. According to the World Bank’s ILO estimate. If you take the government’s numbers the shift looks even more stark, from 23% to 42%
6. Again, according to the World Bank. For reference, the UK is 1.06 on the same data. While these changes might sound small, remember they are on a base of an estimated 25 million births a year.
7. According to Reuters.
8. I take the average of trailing and 12-month forward.
9. Source: RBI, Jefferies.
10. Based on weekly data back to 1988, MSCI India versus MSCI ACWI.
You are now leaving Man Group’s website
You are leaving Man Group’s website and entering a third-party website that is not controlled, maintained, or monitored by Man Group. Man Group is not responsible for the content or availability of the third-party website. By leaving Man Group’s website, you will be subject to the third-party website’s terms, policies and/or notices, including those related to privacy and security, as applicable.