Key takeaways:
- Active portfolio risk management, including techniques such as scaling positions inversely with volatility, has suffered some pain in 2025 to date, having missed out on mid-April’s post ‘Liberation Day’ market recovery
- However, these costs tend to be repaid over the long run, since active risk management is designed to avoid catastrophic drawdowns
- Avoiding these large drawdowns is critical for efficient long-term compounding of capital and allows portfolios to take more exposure when conditions normalise
Markets in 2025: from dispersion to a concerted drop
Today's global economic landscape is characterised by near-unprecedented levels of uncertainty. Political developments are upending the status quo, triggering heightened volatility in global markets as the effects of these shifts ripple through asset prices.
Figure 1: Bloomberg Economics Global Trade Policy Uncertainty Index
Problems loading this infographic? - Please click here
Bloomberg Economics Global Trade Policy Uncertainty Index: Screens publications covering economic, research and political topics for words associated with trade policy uncertainty. Actual words monitored are the same as those in Caldara et al, 2020. Examples include "tariffs", "trade restrictions", "trade negotiations". Source: Bloomberg. Date range: Jan 2009 - Apr 2025.
Much has (rightly) been made of the primary driver of this spike in uncertainty – the US administration’s tariff announcement on 2 April, also known as ‘Liberation Day’ – which provoked a violent market reaction in the days following. These moves have somewhat overshadowed the significant dispersion across asset classes and geographies that we observed in the first quarter.
Specifically, geopolitics, shifting trade dynamics and bifurcated monetary policy and inflation paths, among other factors, led to market divergence in the first three months of the year. Major indices such as the S&P 500, DAX, CAC 40, Hang Seng and Nikkei each followed distinct trajectories, as shown in Figure 2. Importantly, these movements were in stark contrast to recent history, characterised by US exceptionalism and the Magnificent Seven driving US outperformance versus all other regions.
Figure 2: Year-to-date performance of global equities (top) and global bonds (bottom)
Problems loading this infographic? - Please click here
Note: ‘Liberation Day’ tariffs imposed on 2 April 2025. Source: Bloomberg, Man Group Database. Date range: Jan 2025 – Apr 2025.
As noted above, we saw a blanket sell-off in equity markets post-Liberation Day, contrasting with previous levels of dispersion. Bond market dispersion held up slightly better, with US Treasury yields ascending, while European sovereign yields fell, in-line with the conventional risk-off playbook. The US’s non-uniform implementation of tariffs and any potential deals reached with trading partners provide further reason to believe this dispersion will persist.
Despite this, with elevated policy and market volatility driving uncertainty to an all-time high, many investors are now facing the fundamental question: what should you do when don’t know what to do?
The easiest option might seem to be to retreat to cash. While cash today might pay attractive yields and shield investors from market volatility, it is not without opportunity cost nor the risk of value erosion from inflation. Further, in most cases, holding cash precedes an inevitable return to risk assets, creating the additional challenge of finding attractive re-entry points.
As such, we believe the fundamental concepts of 1) maximising diversification, 2) dynamic exposure management, and 3) tail awareness offer the most compelling compromise between running upside risk and managing downside risk during the most uncertain of times. We expand on each, in turn, below.
1. Diversification: what to own in a fragmented world
Diversification serves as an antidote to uncertainty. While we cannot predict which markets will outperform, maintaining broad exposure across regions and asset classes serves to manage risk in fragmented market conditions.
Global equity markets staged a coordinated partial recovery following the US tariff reprieve, mirroring April's synchronised decline. However, policy divergence has reached levels not seen in recent years, which creates an environment that could foster higher dispersion across regions in the medium-term. While intuition would say that allocating to a global equity index is a prudent approach to regionally diversify, as discussed in Read This Before You Go All In on US Equities, the skew towards the US in market-cap based indices (as shown in the top chart in Figure 3) means that this diversification isn’t quite as robust as one might think . Indeed, it leaves investors primarily exposed to the performance of US stocks, which could be a risk if the US continues to adopt what the market perceives as less-friendly policies, particularly given concentration and valuation concerns. Constructing a portfolio that allocates based on maximum diversification (bottom chart in Figure 3) mitigates against this by balancing risk across different regions and leading to better long-term risk adjusted performance.
Figure 3: Allocations of MSCI ACWI (top) and risk-based approach (bottom)
Problems loading this infographic? - Please click here
Source: Bloomberg, MSCI, Man Group Database. Date range: Jan 2019 – Apr 2025.
Figure 4: Long-term performance (top) and Sharpe ratios (bottom) of risk-based approach versus equity indices
Problems loading this infographic? - Please click here
Problems loading this infographic? - Please click here
Note: Indices selected on an ad-hoc basis. Returns reflect futures returns hedged to USD. Source: Internal Man databases, Bloomberg. Date range: Jan 2000 – Apr 2025.
2. Volatility-based allocation: adapting exposure when return forecasts fail
Alongside diversification, volatility can be a useful tool in uncertain times. Taking a systematic approach removes emotional decision-making from the investment process and allows for incremental adjustments to market exposure rather than all-or-nothing positions. This method minimises reliance on speculative forecasts and uses objective measures of volatility to modulate exposure, rather than attempting to trade each policy pivot.
The volatility-based method is conceptually straightforward: when volatility spikes, models systematically reduce exposures; as volatility normalises, models gradually increase exposures. This approach maintains consistent risk levels rather than fixed dollar exposure, recognising that changing market conditions lead to fluctuations in risk – and importantly, that higher volatility periods don't necessarily lead to higher returns, as illustrated in this empirical paper.
We can take various views of volatility: for example, short-term, long-term or option-implied. In the case of the market dislocation in April 2025, just about every measure of volatility was pointing to reducing investment exposure and pivoting towards a more cash-heavy portfolio.
Volatility-based adjustments integrate naturally with a diversification strategy – when certain markets become more volatile, their risk contribution increases, triggering an automatic rebalancing that maintains the desired risk distribution across markets.
Figure 5: Impact of volatility scaling on bond exposure
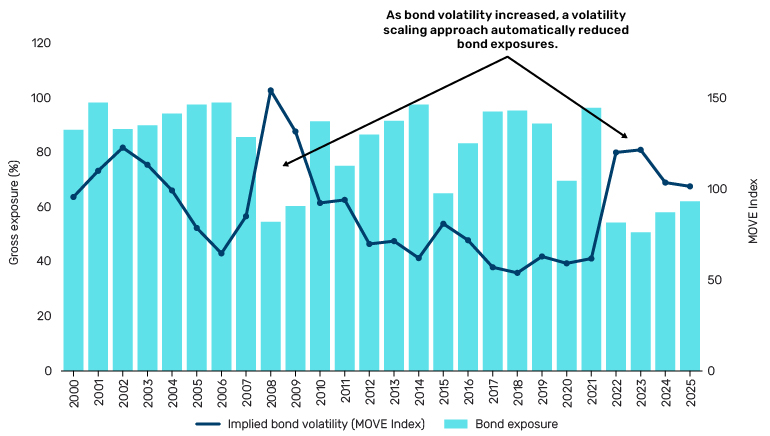
Source: Bloomberg, Bank of America Merrill Lynch, Man Group Database. Showing the gross exposure of a representative volatility-scaled strategy. Date range: Jan 2000 - Mar 2025.
3. Systematic risk management: managing the inevitable fat tails
Even with perfect diversification and robust volatility scaling, investors must still contend with fat-tail events, describing extreme market movements that occur more frequently than standard models predict. These events are painful but unavoidable realities of financial markets. However, there is a critical difference between experiencing manageable pain and suffering catastrophic outcomes that permanently impair capital.
A systematic risk-managed approach acknowledges these tail risks and implements objective measures to mitigate their impact. By focusing on measurable factors like volatility, momentum, and correlation, investors can build portfolios that adapt to changing market conditions without requiring perfect foresight of specific market movements.
In the same vein as volatility scaling, these measurable factors, or overlays, operate by modulating investment exposure depending on the prevailing conditions in markets. During periods of heightened stress, portfolio exposures can be reduced to help mitigate drawdowns and enhance risk-adjusted outcomes over the long run.
Figure 6: Impact of systematic risk management on drawdowns
Problems loading this infographic? - Please click here
Source: Man Group Database. Date range: Jan 2000 - Apr 2025.
However, this approach isn't without trade-offs. Sometimes markets experience whipsaw events that cause volatility to spike temporarily, triggering a risk reduction that may seem unnecessary in hindsight. These moments can be frustrating but represent the cost of protection against truly catastrophic outcomes, which is critically important when compounding returns in a portfolio.
Volatility has a directly negative impact on compounding through volatility drag (or "variance drain"). Put simply, if two portfolios have the same average return each month, the portfolio with higher volatility in those returns, such as a static portfolio without volatility or tail management, will achieve a lower compounded or geometric mean return. This happens because losses and gains are not symmetric. For example, a 50% loss requires a 100% gain to break even. In fact, as volatility increases, the gap between the arithmetic (sum) return and the geometric return widens, dragging down the overall compounded performance, underscoring the need for a dynamic portfolio that manages volatility and drawdowns.
Figure 7: Impact of volatility on compounded returns
Source: Man Group Database. Schematic illustration. Under standard assumptions – particularly when returns are small and approximately normally distributed – the relationship between arithmetic and geometric returns can be approximated by: geometric return = arithmetic return - 1/2 x variance.
The formula for successful long-term investing combines two complementary elements: generating returns by applying appropriate leverage when conditions are favourable and preserving capital through systematic risk management when conditions deteriorate. Active risk management – through volatility and systematic measures – is designed to achieve the latter, and by extension, enhances the compounding of returns.
Parting thoughts
Uncertainty is the antagonist of conviction. In times of heightened uncertainty and volatility, the most prominent challenge investors face, and indeed a conundrum we have debated, is determining the most appropriate path forward, hence the title of this note.
We believe that the answer, in the absence of return forecasting power or a crystal ball, is to focus on the fundamental concepts of diversification, volatility-based exposure management and systematic risk overlays to safeguard the tail.
As we have seen in 2025 so far, the latter two may at times lead to painful, but manageable, losses. However, it increases the probability of avoiding catastrophic drawdowns that can permanently impair the growth of capital over time. In our view, this is therefore a more robust long-term approach.
The authors would like to thank Max Buchanan, Otto Van Hemert and Edward Hoyle for their contributions.
Bibliography
Buchanan, M., Abou Zeid, T., Weidner, P., and Koutsouri, K. (2025), “Views from the Floor – Read This Before You Go All in on US Equities”, Man Institute, Available at: https://www.man.com/insights/views-from-the-floor-2025-february-11
Harvey, C, R, Hoyle, E, Korgaonkar, R, van Hemert, O. (2018), “The Impact of Volatility Targeting”, Man Institute, Available at: https://www.man.com/maninstitute/the-impact-of-volatility-targeting
Hoyle, E. (2024) “Risky Business: Why the Smart Money Forecasts Risk, Not Returns”, Man Institute, Available at: https://www.man.com/maninstitute/risky-business-why-the-smart
Korgaonkar, R., Robertson, G. (2021), “We See Risk Where Others May Not: Active Risk Management in Practice”, Man Institute, Available at: https://www.man.com/maninstitute/active-risk-management-in-practice
Korgaonkar, R. (2024), “The Big Picture: Forecast Fatigure – Diary of a Quant”, Man Institute, Available at: https://www.man.com/insights/the-big-picture-forecast-fatigue
You are now leaving Man Group’s website
You are leaving Man Group’s website and entering a third-party website that is not controlled, maintained, or monitored by Man Group. Man Group is not responsible for the content or availability of the third-party website. By leaving Man Group’s website, you will be subject to the third-party website’s terms, policies and/or notices, including those related to privacy and security, as applicable.