Key takeaways:
- Traditional risk management systems rely on historical price movements to project risk, but option-implied volatility data can provide forward-looking insight into market risk expectations
- While implied volatility indices like the VIX offer timely signals of changing risk levels, they capture only a fraction of the information available. The full volatility surface — incorporating term structure and skew — provides a more complete picture
- Examining episodes including the FX carry trade unwind and the bombing of Iran's nuclear facilities, we demonstrate how volatility surfaces respond to market stress and its resolution, offering richer insights to enhance systematic risk management
Introduction
When attempting to categorise geopolitical risks, former US Defense Secretary Donald Rumsfeld noted:
“There are known knowns. These are things we know that we know. There are known unknowns. That is to say, there are things that we know we don't know. But there are also unknown unknowns. There are things we don't know we don't know.”
This same categorisation can be applied to portfolio risk management.
Traditional risk management systems rely on historical price movements to project risk. When confronted with known unknowns (such as upcoming elections or data releases), their backward-looking bias can lead them to underestimate foreseeable risks. Unknown unknowns present a different challenge, however. Here, the lack of visibility means our best defence is diversification. Even when struck by an unforeseen shock, we can expect some parts of a diversified portfolio to outperform.
Where these events are more similar is in their aftermath. In both instances, models using backward-looking data may mechanically overstate risks that are in the rearview, even if markets have already moved on. Where, then, can we look for timely, reliable signposts of future hazards (or the absence thereof)?
Enter the options market. No-arbitrage pricing has long linked options prices to expected volatility, to the point where it is convention to quote certain options in terms of their “implied volatility”. Additionally, given we can observe these values in live market pricing, they offer a contemporaneous view of market risk expectations. Put differently, options data can provide sight of known unknowns and can indicate market normalisation after a period of stress. But, as with much in life, worthwhile endeavours are rarely simple. Options data is multidimensional (e.g. strike, maturity, payoff function) and noisy. The challenge, therefore, is to systematically collect, distil and transform it into actionable insights for better forecasting and managing of portfolio risk.
In this paper, we explore the various dimensions of option-implied volatility data and show how its behaviour during and after periods of market stress can provide additional insight into market risk expectations.
Implied volatility indices
Before delving into the complexities of options implied volatility data, let us first consider the most foundational dimension: the level. Derived from options prices, the implied volatility level provides a measure of expected future volatility for an underlying asset. The best-known example is the VIX, an implied-volatility index based on one-month S&P 500 option prices. Dubbed the “Fear Index” by some market commentators, it is commonly seen as a measure of investor risk aversion: the willingness to pay for protection or to participate in upside moves.
In Figure 1, we show the VIX overlaid with “crisis periods”, as defined in the Best of Strategies for the Worst of Times (top panel), and drawdowns of the S&P 500 (bottom panel) as a means of assessing how the VIX behaves around crises and non-crisis periods.
Figure 1: The VIX (top panel) and S&P 500 drawdowns (bottom panel) overlaid with crisis periods


Source: Bloomberg and Man Group database. Date range: January 1990 – September 2025.
The chart shows that the VIX typically spikes as the S&P sells off and falls back as the S&P recovers – clearly reactive to market events. Notably, its response is often faster than typical measures of realised volatility, which aligns with intuition that implied volatility indices offer a contemporaneous view of volatility expectations – a desirable characteristic in the management of known unknowns. The level may also be elevated for prolonged periods, as in the Global Financial Crisis (GFC), or over more brief windows, as in April’s tariff-related market stress. However, as we will show, the level captures only a fraction of the information available across the entire spectrum of data contained in options.
Implied volatility surfaces
Let us now turn to the implied volatility surface, which offers a richer view. By aggregating options data across strikes and expiries, a volatility surface maps implied volatility across three dimensions: moneyness (how an option’s strike relates to the underlying asset’s current price), time-to-maturity, and overall volatility level. Multiple methods can be used to fit these volatility surfaces, with the most common approach using parametric models, which are calibrated to the prices of individual options. These surfaces inherently capture skewness and term structure information, providing additional insight into market expectations of risk. We take these concepts in turn below, extending our S&P 500 analysis to examine how the index’s implied volatility surface evolved during the August 2024 “FX carry unwind”, which triggered a sharp sell-off across global equity indices.
Implied volatility surface: skew
To better understand skew, we begin by comparing options that have the same time-to-maturity (in the example below, 30 days). This allows us to visualise how options pricing varies based on whether the strike is above or below the current price. Following standard practice, we fit our volatility surfaces to out-of-the-money (OTM) options: calls when moneyness is positive (strike above spot) and puts when moneyness is negative (strike below spot). Figure 2 plots this two-dimensional surface of 30-day implied volatility across different strike prices (captured by moneyness) prior to the FX carry unwind, establishing a baseline. The curve exhibits a “skew” that is typical of a normal market environment, where implied volatilities are higher for OTM puts than for at-the-money (ATM) options. This is sometimes called a “smirk”, due to its asymmetry, and reflects higher investor demand for downside protection than upside participation (since most option demand is from investors who are already positively exposed to the stock market).
Figure 2: 30-day implied volatility for S&P 500 option prior to FX carry unwind episode
Problems loading this infographic? - Please click here
Source: Man Group database. Date: 1 July 2024.
Implied volatility surface: term structure
We can also slice the volatility surface along the time-to-maturity axis while keeping moneyness fixed. The “square-root” rule is a common scaling rule-of-thumb in financial markets, stemming from the assumption that price returns are independent and identically distributed (IID). It states that the (unannualised) volatility of returns increases proportionally with the square-root of the time horizon. For example, the volatility of a four-week return is roughly twice that of a one-week return. In reality, market returns are not IID and there are known unknown events, which means the expected volatility does not increase with the square-root of time.
Figure 3 plots the ATM implied volatility for the S&P 500 prior to the FX carry unwind, illustrating how risk is priced across different expiries. Two key observations emerge: first, as expected, there is a general increase in expected volatility for options that expire further in the future – a natural reflection of compounding uncertainty over time. Second, the increase is not linear. Notably, the term begins to level-off approximately five months out, which coincides with the January 2025 inauguration date. This flattening may reflect investors pricing in a sustained period of elevated risk around the incoming US administration’s policies – an example of how known unknowns manifest in implied volatility data.
Figure 3: ATM implied volatility for different S&P 500 option expiries over FX carry unwind episode
Problems loading this infographic? - Please click here
Source: Man Group database. Date: 1 July 2024.
Implied volatility surface: FX carry unwind
Combining each of the three principal features we have examined so far – level, skew, and term structure – gives us a richer, multi-dimensional body of information, shown by the surfaces in Figure 4. We include multiple dates to demonstrate that the shape of implied volatility surfaces varies over time, particularly around periods of market stress. The four dates below span the period before, during and after the FX carry unwind episode in August 2024.
Figure 4: Volatility surface for S&P 500 over FX carry unwind episode
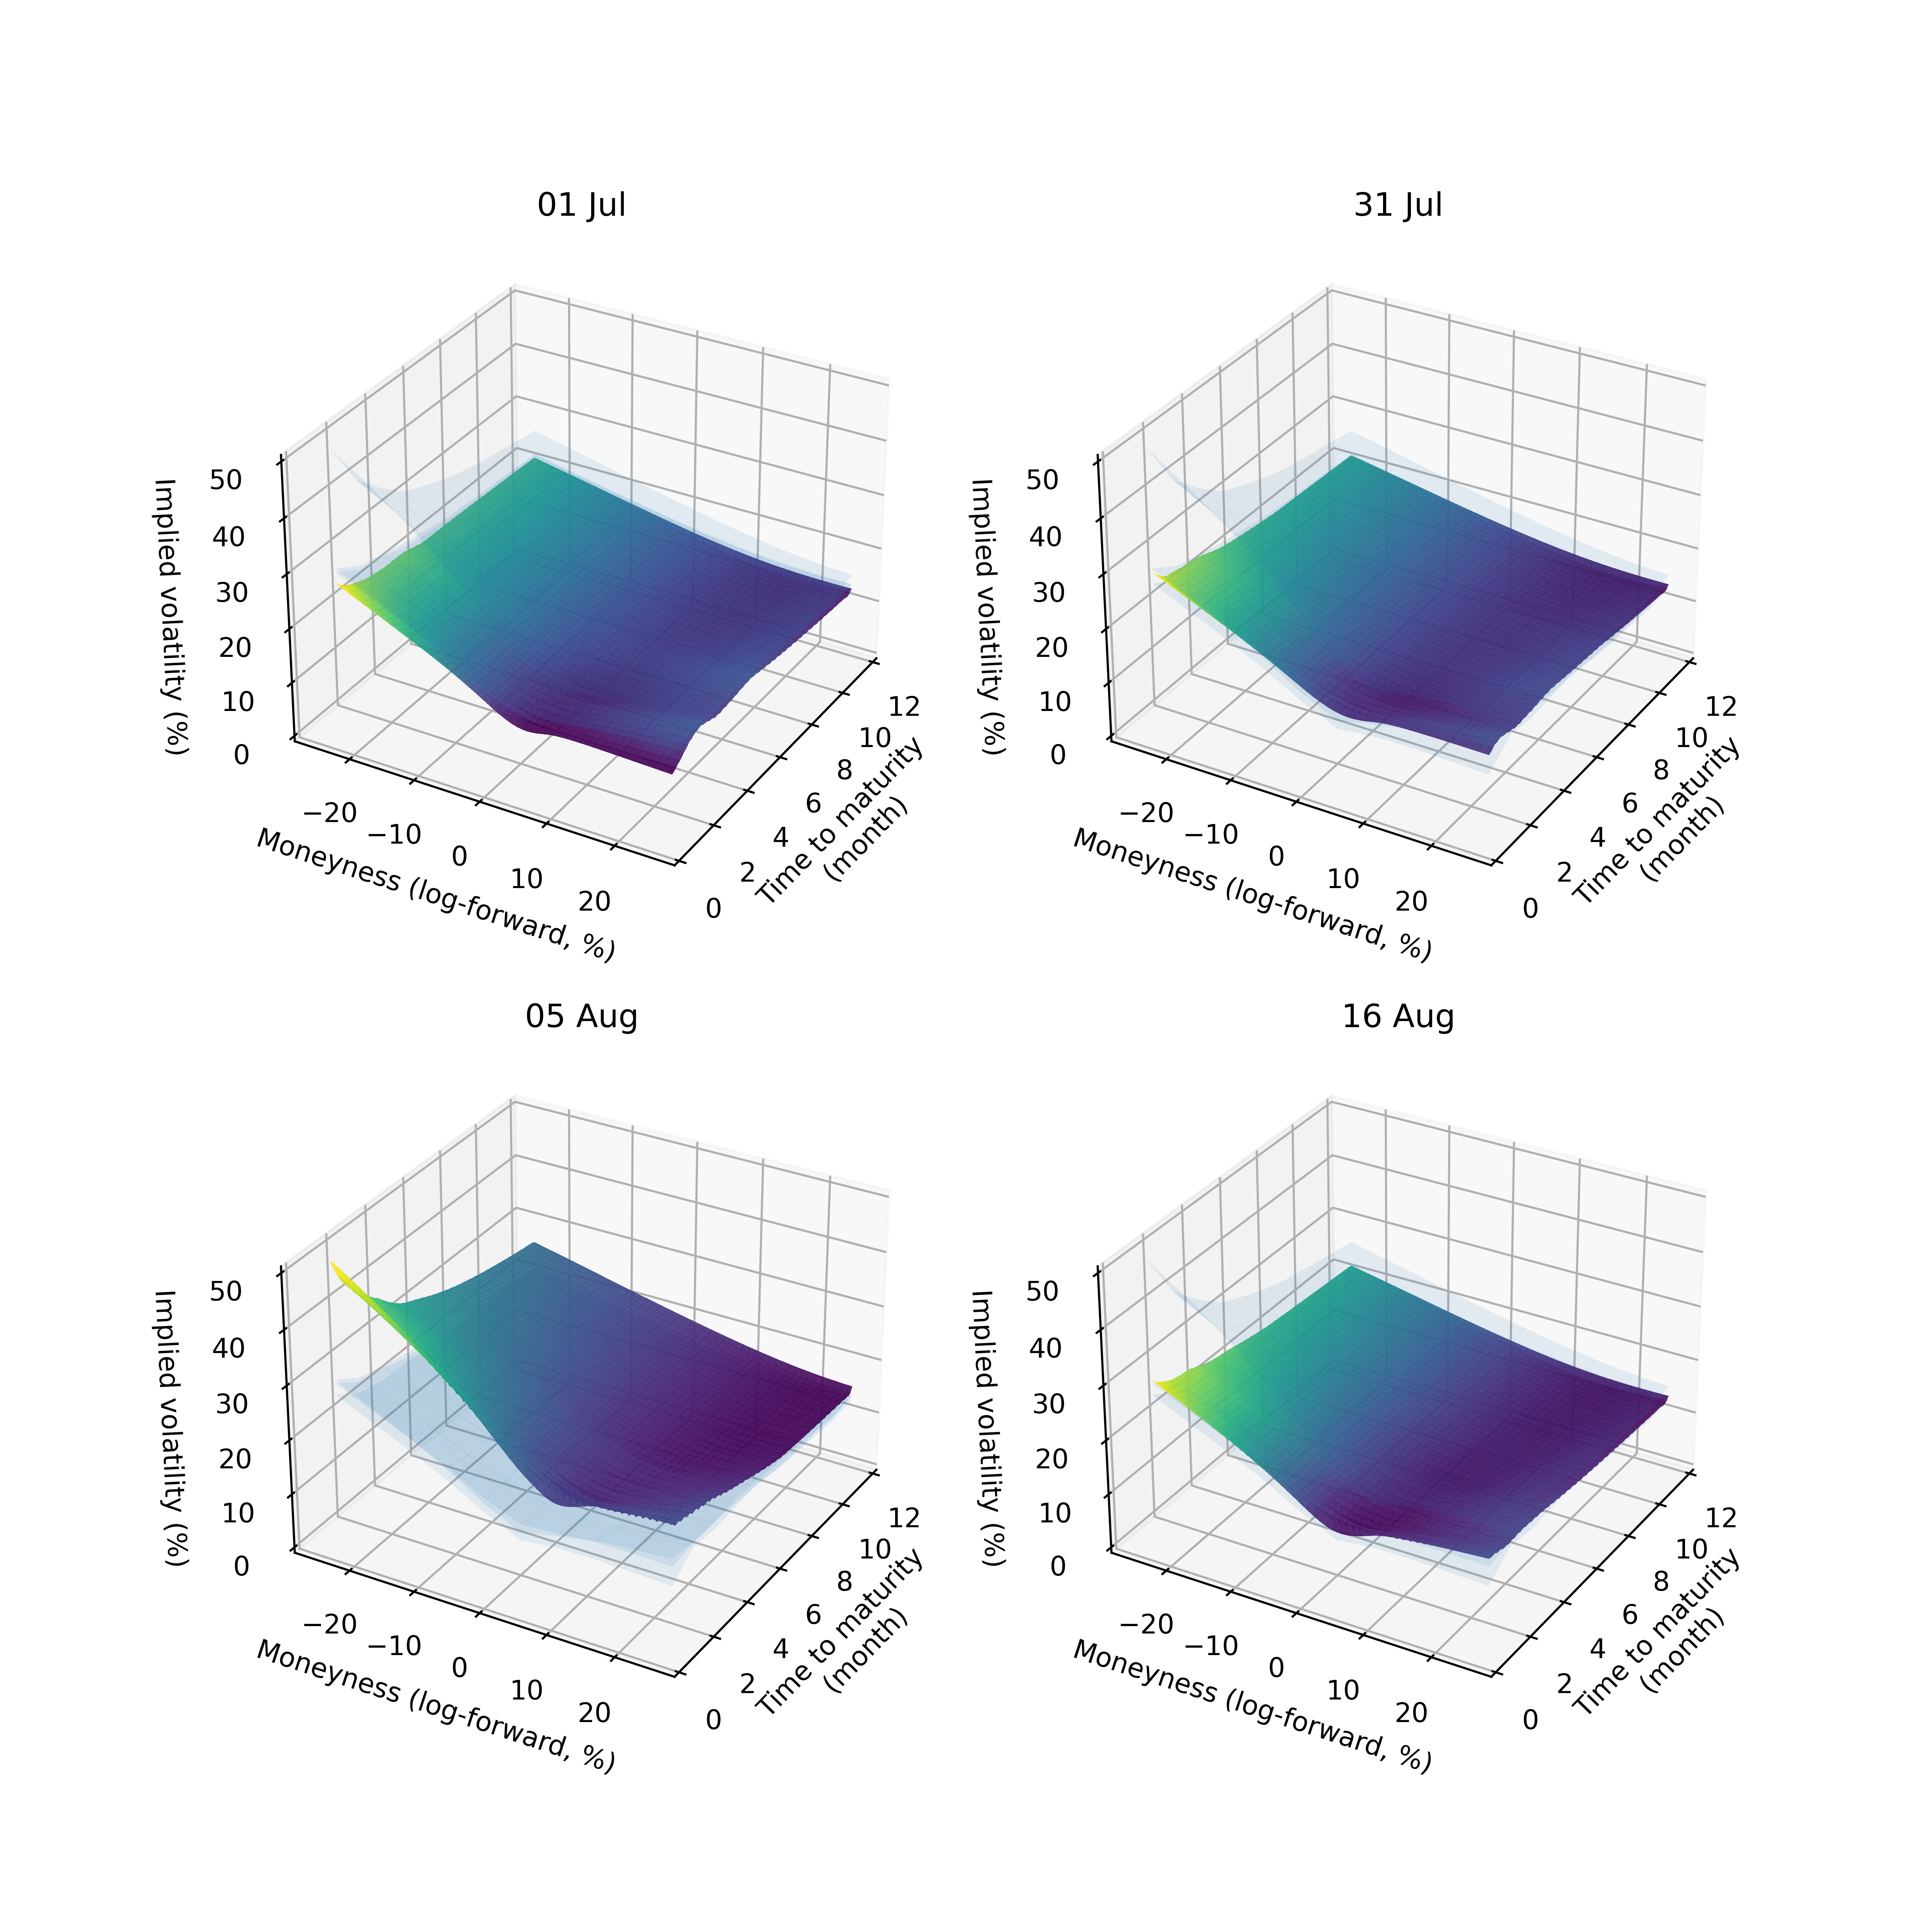
Source: Man Group database. Date range: 1 July 2024 – 19 August 2024.
As shown in Figures 2 and 3, prior to the FX carry unwind episode, the term structure and skew were broadly consistent with stable trading periods. However, the combined effect of the Bank of Japan (BoJ) meeting on 31 July and softer-than-expected US non-farm payrolls on 2 August triggered an unwind of the highly levered yen carry trade, leading to equity weakness globally. Options markets rapidly incorporated heightened market fear. By 5 August, the volatility surface exhibited three key changes: a steep uptick in the overall level of implied volatility, a shift in the shape of the term structure, and an increase in (negative) skewness relative to our baseline — collectively indicating increased expectations of further equity declines.
However, much of the fear quickly dissipated in the days following, driven by positive US economic data (including jobless claims) and reassuring comments from Deputy BoJ Governor Shinichi Uchida. Investors increasingly viewed the sell-off as “technical” in nature and expectations of market normality returned. This reduced fundamental concern is discernible in the surface from 16 August, with term structure, skew and overall level of implied volatility all returning to the pre-event baseline shape.
This rapid re-normalisation is striking when compared to volatility measures based on historical prices, which typically carry echoes of volatility shocks for weeks or months. The high-frequency, high-quality and timely nature of this data makes it a prime candidate for inclusion in a dynamic risk management system.
Options data is not limited to equities but is available across asset classes, enabling us to extend its use across a multi-asset portfolio. While volatility surface dynamics vary by asset class — much like the price returns of their underlying assets — important similarities remain. Next, we will explore this through an example in a commodity market: the evolution of implied volatility in Brent crude oil in the weeks surrounding the bombing of Iran’s nuclear facilities in June 2025.
Crude oil: bombing of Iran’s nuclear facilities
Geopolitical events are a major source of risk in global, multi-asset portfolios, regularly influencing commodity pricing and volatility. Unlike equities, however, commodities exhibit more two-tailed outcome distributions, with greater potential for significant price moves in either direction. Taking oil as an example, prices are subject to downside risk associated with shocks to global growth, which can drive demand down. Additionally, oil prices are subject to upside risk stemming from supply shocks, such as OPEC decreasing output, or conflict disrupting production or shipping channels. In Figure 5, we explore how a potential supply shock affected the implied volatility surface of oil prices by tracing its evolution before, during, and after this year’s Twelve-Day War between Iran and Israel.
Figure 5: Volatility surface for Brent crude oil surrounding the Iran bombing episode
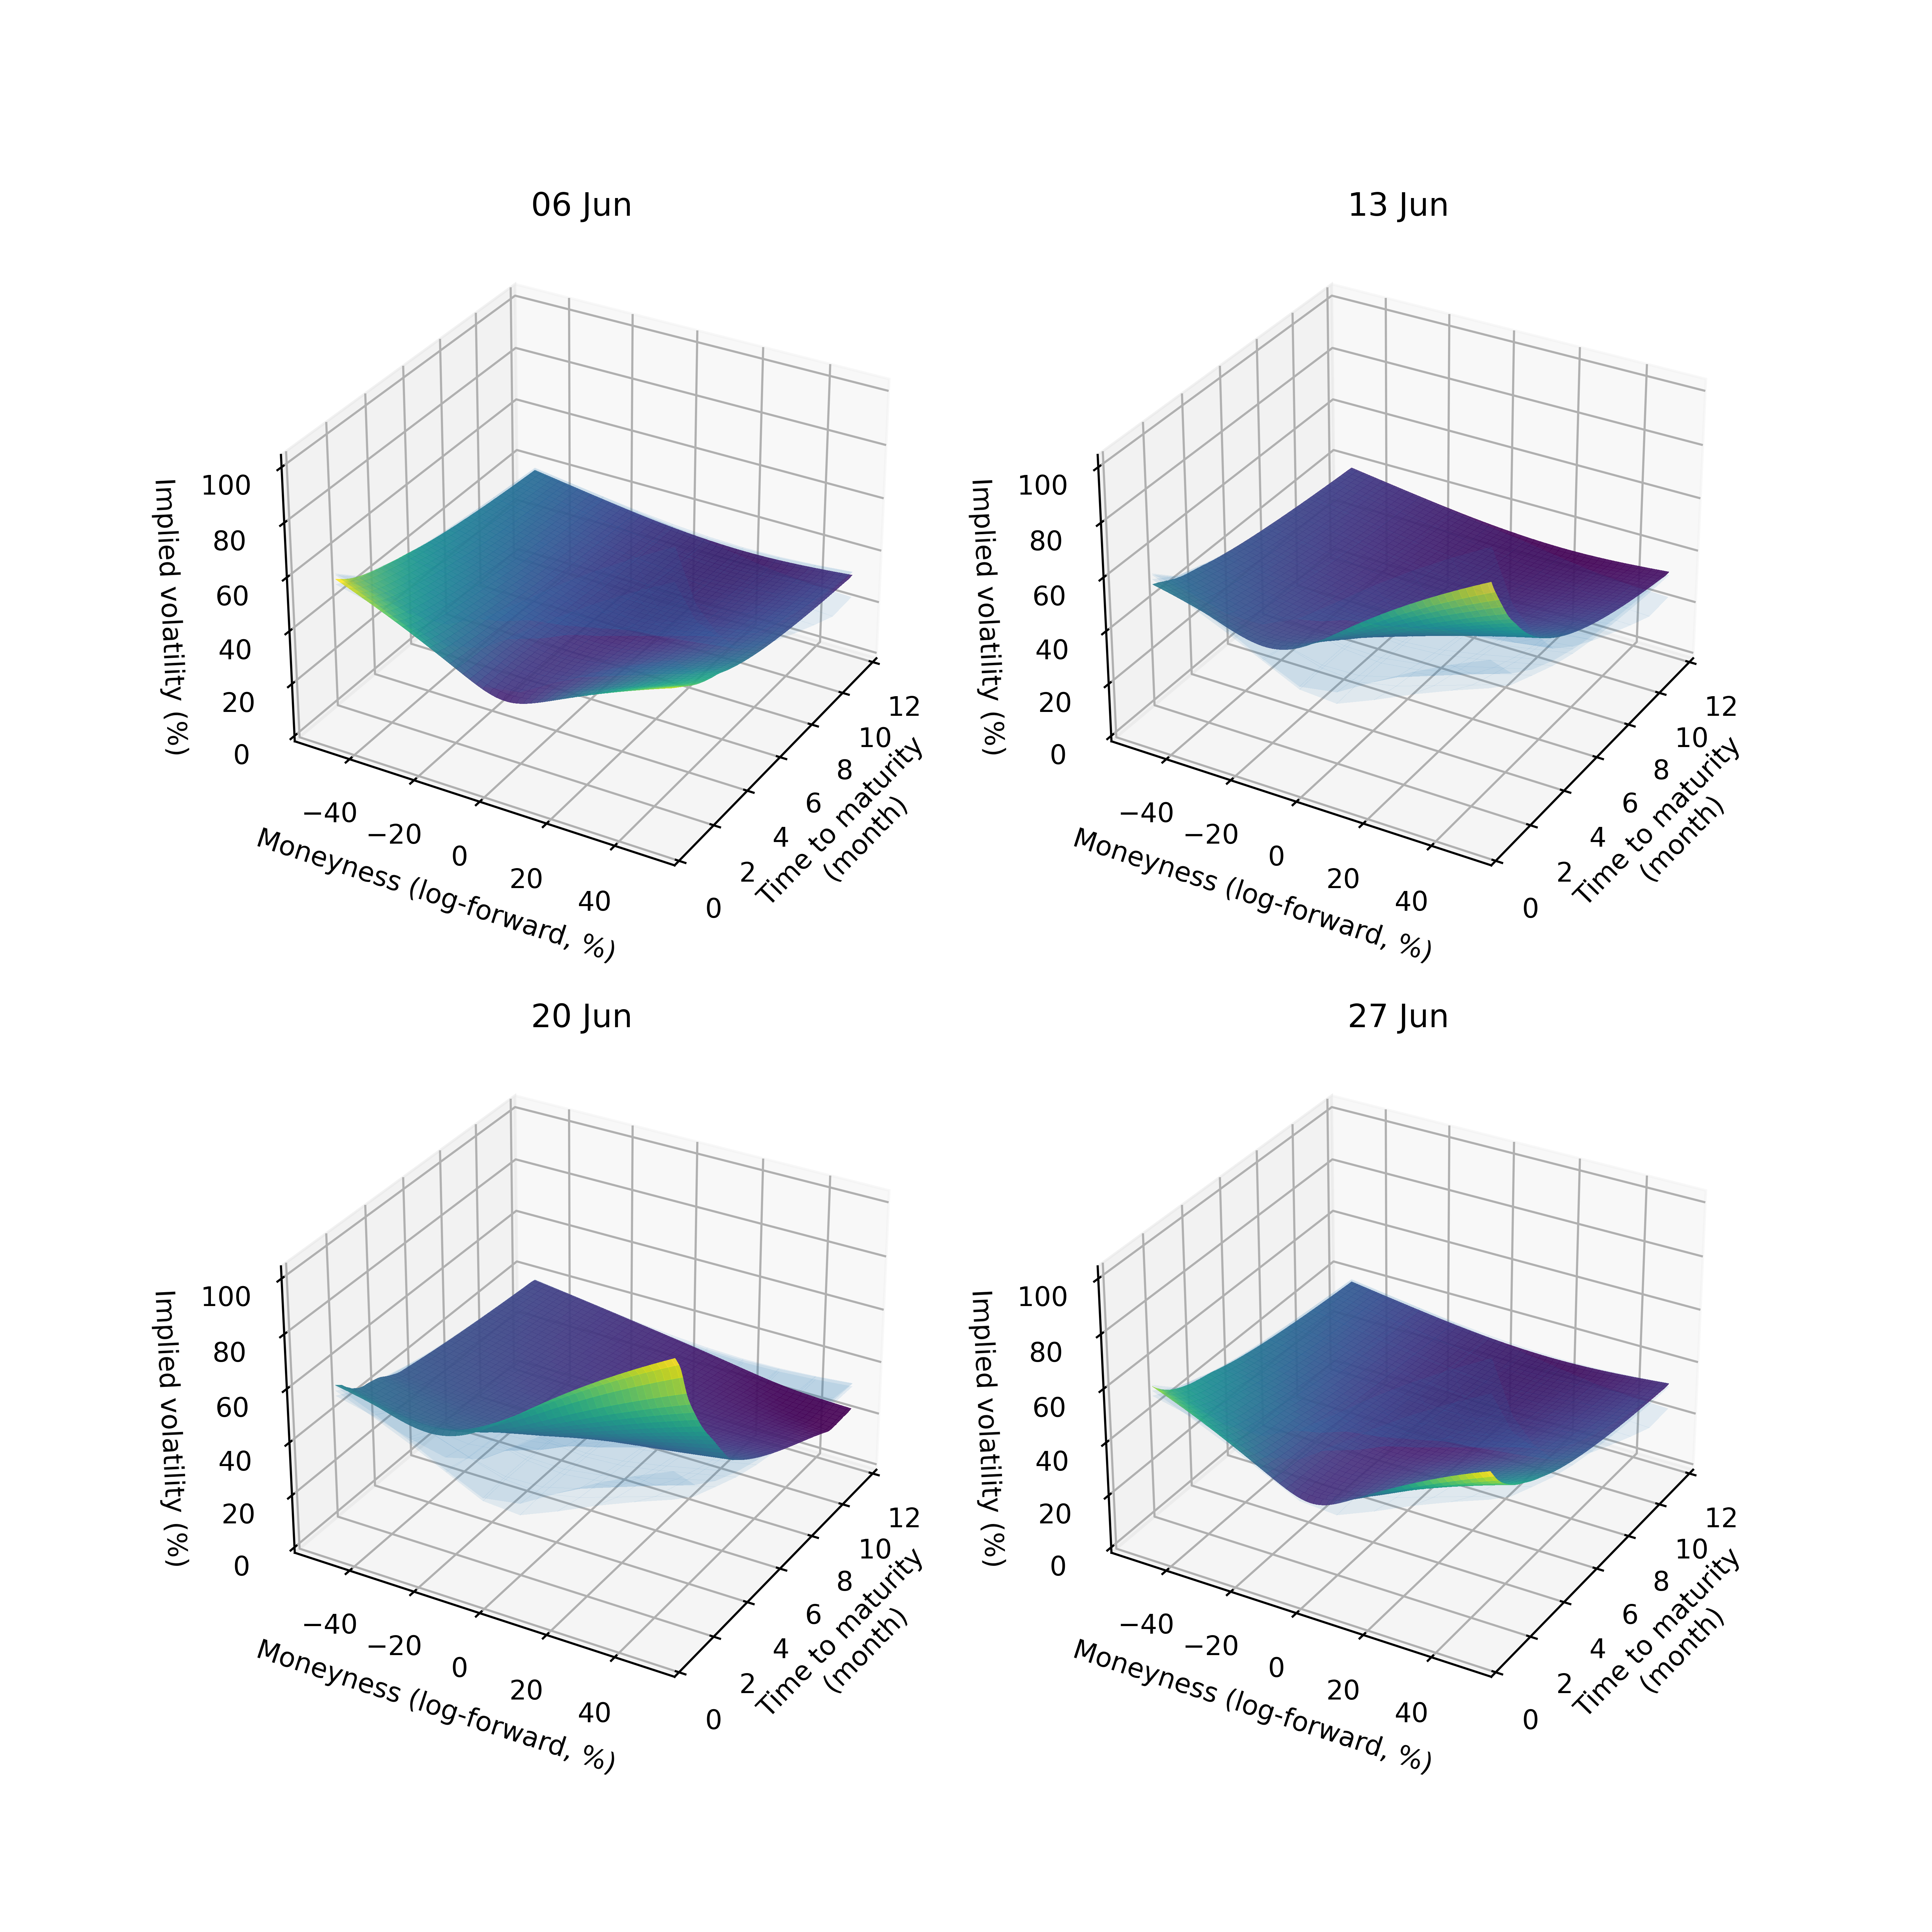
Source: Man Group database. Date Range: 6 June 2025 – 27 June 2025.
In Figure 6, we examine the two-dimensional plots of 30-day implied volatility skewness and the ATM term structure to observe how the options markets priced in heightened risk to energy infrastructure as tensions escalated and then re-normalised after the war ended.
Figure 6: Term structure (top panel) and volatility skew (bottom panel) of Brent Crude surrounding the Iran bombing episode
Problems loading this infographic? - Please click here
Problems loading this infographic? - Please click here
Source: Man Group database. Date range: 6 June 2025 – 27 June 2025.
On 6 June, both cross-sections exhibited curve shapes consistent with normal trading periods. The skew curve displays a smile shape (assets subject to shocks in both directions are more akin to “smiles” than “smirks”) and the term structure is upward-sloping at the front of the curve.
By 13 June, the day Israel carried out strikes on Iranian military officials and nuclear sites, the shapes of the curves changed dramatically. In the aqua blue line in the top plot, heightened supply risk shifted the skew, with higher implied volatility for OTM calls relative to OTM puts. The term structure also began to slope downwards, as short-term implied volatility rose, while longer-term expectations hardly moved. Combined, the surface underscores the market’s fear of a near-term, upside price shock.
As speculation increased that the US would potentially act to further impair Iran’s nuclear facilities, the implied volatility surface remained dislocated. Indeed, on 19 June, President Trump set a two-week deadline to determine whether the US would take military action, intensifying fears around potential threats to energy infrastructure. Chief among these concerns was the possibility of Iran closing the Strait of Hormuz, through which 20% of global oil flows daily.
Ultimately, the US launched strikes on Iran’s nuclear facilities on 22 June, followed by a rapid diplomatic push for de-escalation. The Strait of Hormuz remained open, and an Iran-Israel ceasefire was reached on 24 June. Markets calmed in response, and the implied volatility surface quickly re-normalised, as evidenced by the 27 June purple lines. Once again, the shape of the implied volatility surface proved highly responsive to both the onset and the resolution of the risk event.
Parting thoughts
We have previously outlined how active managers can use risk forecasting to improve risk-adjusted returns. The focus there was on realised measures of risk. Here, we have explored various expressions of option-implied volatility and how they can provide a complementary view of risk. While volatility indices, such as the VIX, offer useful information about the level of implied volatility, they simplify the richer perspective available in volatility surfaces. By incorporating information from the term structure and skew of implied volatilities, we gain a more comprehensive view of forward risk expectations, that are reactive not just to the onset of risk but also to its rapid dissipation. These features make volatility surfaces highly additive within the context of a systematic risk management process.
You are now leaving Man Group’s website
You are leaving Man Group’s website and entering a third-party website that is not controlled, maintained, or monitored by Man Group. Man Group is not responsible for the content or availability of the third-party website. By leaving Man Group’s website, you will be subject to the third-party website’s terms, policies and/or notices, including those related to privacy and security, as applicable.