Key takeaways:
- There's been no need for investors to get too creative over the last 10 years, when the S&P 500 has performed as well as it has done
- I think this may be changing. I've been through some of the drivers in recent notes. Here, instead, we take this as a given and run through 10 investment ideas which may benefit from this new world
- This is Part 1. Gold, Japanese corporate governance, oil, defence, infrastructure. Part 2 is coming to cinemas near you early next year
Please note that the opinions discussed below are those of the individual authors and do not reflect a Man Group house view. Further, any organisations/financial instruments mentioned below are shown to illustrate the author’s market outlook and should not be construed as a recommendation for any purchase or sale. All market data referenced below sourced from Bloomberg unless otherwise specified.
‘Unprecedented’ has many precedents, as Man Group’s President, Steven Desmyter, pointed out in his introduction to the firm’s Stockholm conference last week. Steven looked back on a speech he’d given in the same place almost a quarter-century earlier in 2001 – post-9/11 and dot-com crash – when he’d used the word twice in as many sentences. With experience comes the recognition that ‘this time it’s different’ is rarely true. But what seems to me uncontroversial is that, when it comes to investment, imagination has not been your friend over the past decade or so.
In his 2006 paper A Quantitative Approach to Tactical Asset Allocation, Meb Faber outlined a simple yet brilliant strategy for asset allocation: equal weight across five liquid asset classes (US stocks, rest of world [RoW] stocks, US Treasuries, commodities and real estate investment trusts [REITS]) for diversification, and time those segments using trend-following. If the asset is trending higher, hold it; otherwise put that segment of the portfolio into cash. In Figure 1, I show an adapted version of Meb’s strategy (see footnote for full details), with some summary statistics, and the post-2013 period (when the paper was last updated) highlighted.
Figure 1. An adapted version of Meb Faber’s asset allocation strategy (‘Diversified Trend Timed’)1
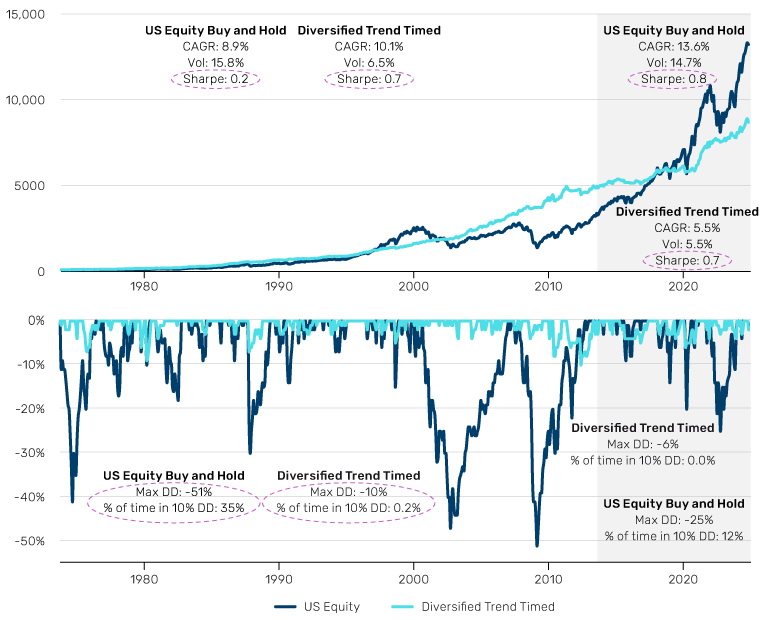
Source: Bloomberg, Man Group calculations. The Diversified Trend Timed portfolio is equal weighted between MSCI US Equity, MSCI EAFE Equity, Bloomberg Barclays US Treasury Agg, GSCI TR and FTSE NAREIT. It is long each asset where that unit is 1% or more above its trailing 10MMA, otherwise it holds US cash for that portion of the portfolio.
Had you looked back from 2013, you’d have liked what you saw: a Sharpe ratio more than three times that of US equity buy-and-hold (the dark blue line). And most eye-catching, a maximum drawdown a fifth of the magnitude, and spending just 0.2% of the time in a 10% dip, compared with a third of months for US equity buy-and-hold. Since 2013, Diversified Trend Timed has a similar profile, with its risk-adjusted return identical to the old days. But boredom has been the belle of the ball, as the Sharpe of US equity buy-and-hold quadrupled. As discussed in my last note1, ‘buy the S&P 500 Index and forget all about it’ has been the big winner. Alpha (of which market timing is a part) and diversification have been the two ugly sisters, by comparison.
There is no reason why this must change any time soon. But in my view, the time has come to consider whether it may, and what ideas within our portfolios might stand to benefit. Over this note and one other (likely early next year) I’ll give you 10 key themes. I’ll rattle through the first five here, and may revisit in more detail in future letters. Hold on to your hats.
#1 Gold and its cousins
Proponents of multipolar-world and de-dollarisation theses can get overly breathless. The US dollar is still the world's gold standard, even if no longer backed by it. However, the ‘weaponisation of the dollar’ narrative clearly has some validity, and it is a fact that global central banks have been increasing holdings, possibly in response. The Economist estimates that the yellow metal as a share of global reserves has moved from 6% in 2015 to 11% today. Still a long way from the 30%+ levels seen in the 1980s. This theme could have road left to run.
Other constituents of the precious-metals complex have not responded in a similar manner to previous gold bull markets. Figure 2 shows year-on-year performance of gold and the average equivalent period of silver, platinum and the return relative to the market of gold mining stocks. The light blue line, representing the latter, usually has a beta north of one when the former is in hard rally mode. This time around it’s close to 0.5. So even if you think the recent run has gone too far given where real rates are, there are other ways to play this theme.
Problems loading this infographic? - Please click here
#2 Supply chain reshoring and Japanese corporate-governance reform
Japan is a beneficiary of ‘friendshoring’ from the West, away from China. As this process evolves, Japanese corporate-governance practices may be brought into closer alignment with Western norms. The Japan equity market can have Byzantine corporate structures, and has historically been resistant to shareholder pressure for capital returns, reinvestment and consolidation. This has capped multiples. But there is a growing sense that change is afoot. Recent news flow includes Seven & i engaging with an unsolicited foreign takeover bid, and then, separately, what could potentially be the largest management buyout in history; Nissan’s stock spiking on reports that activists are circling; and Mizuho announcing its first buyback since 2008. We spoke to our Japanese equities team and asked them to give us the five companies they assess would be the biggest beneficiaries of further corporate governance momentum. In Figure 3 we show the price-to-book ratio in aggregate of these five, alongside that of the TOPIX.
I see this theme as early in the first leg. As you can see in the chart, these names are trading at a considerable discount to the wider region. Moreover, in aggregate, these still trade at a discount to book value, despite threats from the Tokyo Stock Exchange to drop index constituents persistently trading below 1x, if tangible plans to increase return on equity are not set out.
In addition, the governance theme is in effect playing out at two levels. At a corporate level, as discussed, but also on a more macro plane, in terms of the reversion to orthodoxy from the Bank of Japan (BoJ), at least relative to recent history. While the Japanese yen has weakened considerably over the past few weeks, on a 10-year view, the premise of this note, I do believe in the continued BoJ realisation that sound money is the foundation of a sound economy. As outlined in the August note, the yen is now wildly cheap on most valuation frameworks, and the distribution of credible pathways from here is, in my view, skewed toward appreciation.2 Holding corporate governance beneficiaries unhedged for a non-yen denominated investor offers opportunity via both an equity and FX driver.
Problems loading this infographic? - Please click here
#3 The energy transition: The neglected old
My belief is that the dirty stuff is going to be vital in an orderly transition to a green world. There is a political dimension to this. If the evolution is too turbulent, and it invokes energy-cost unpredictability for the consumer such as we saw in 2022, then people will not stomach it, and that will be reflected by politicians.
The problem is that we have seen significant erosion in the capital base for many oil and coal producers. In the 10 years to 2015, average net capital expenditure per annum for the world’s top 25 publicly listed oil and gas companies was more than US$90 billion. In the eight years since it has averaged -US$10 billion. Yes, that’s a minus sign. In other words, depreciation has outweighed gross capital formation. This is exacerbating periods of energy turbulence, as we saw two years ago.
We need more slack in the system, as the political class is increasingly realising. Trump’s ‘drill, baby, drill’ rhetoric has moved the Overton window on traditional energy extraction. And many of the beneficiaries are not yet valued accordingly. Figure 4 shows multiples relative to recent history for Halliburton and Schlumberger, two of the major oil and gas services companies. On this basis, both are very cheap. In a sense, this is no surprise, these are cyclical businesses whose chief commodity, oil, is in a heavily backwardated posture. But I view this curve shape as a mispricing. I think we have moved from a world of resource abundance to scarcity, and therefore the energy complex is going to run at a structurally higher price level. As a result, I think the kind of valuations in Figure 4 are too cheap.
Problems loading this infographic? - Please click here
#4 Tooling back up
Beating the swords into ploughshares has always seemed a long way off. But for some time, it seemed like it was going in that direction. Figure 5 shows military spending as a proportion of gross domestic product (GDP) for the world, and various regions, with the NATO 2% target highlighted. At the Cold War’s height, the globe dedicated 6% of its output to weaponry. Since then, the peace dividend has broadly allowed the world to transition from guns to butter.
Sadly, times are changing. 2.5% is the new 2.0%, and the European Union (EU) is well below even the old target. Now with a US administration insisting, quite reasonably, that others should buy their rounds, it is no surprise that we’ve seen a drumbeat of defence spending commitments. Even small increases in the global spend could have meaningful impact on revenues of the big contractors. 150 basis points on the world line of Figure 5 equates to US$1.6 trillion incremental annual spend. Adding up the revenues of the top five European and US supermajors gets you to US$315 billion. The potential uplift is proportionately large, in other words.
To a degree, this is getting priced in multiples. The top five US defence names in aggregate trade on 18x forward, up five points in five years. The European reaction has been even sharper, from 12x to 19x over the same period, and now at a big premium to the wider region, on 13x. The market perceives defence as one of the continent’s few growth areas: if the EU does have to pay its own tab, it’s at least going to put money in the hands of its own corporations.
I don’t think these implied expectations yet reflect the extent of the strategic priority, on both sides of the pond, as well as other players in this new multi-polar world.
Problems loading this infographic? - Please click here
#5 Rejuvenating infrastructure
Traditional infrastructure in the West is old. Figure 6 shows the age of the average piece of US fixed capital, segmented by private and government assets. The stock needs some freshening. And this is being catalysed by a raft of electioneering – think ‘Levelling Up’, ‘Build Back Better’ and so on. Meanwhile, many of the key names are not reflective of a CAPEX supercycle. A basket we maintain of the top 10 global beneficiaries, trades a forward PE point below MSCI World.
Problems loading this infographic? - Please click here
Coming up next time
Electrification, aging demographics beneficiaries, automation, uranium, India. Plus, how it could all fit together.
1. See: https://www.man.com/maninstitute/road-ahead-against-apathy
2. See: https://www.man.com/maninstitute/road-ahead-yen-behaving-badly
You are now leaving Man Group’s website
You are leaving Man Group’s website and entering a third-party website that is not controlled, maintained, or monitored by Man Group. Man Group is not responsible for the content or availability of the third-party website. By leaving Man Group’s website, you will be subject to the third-party website’s terms, policies and/or notices, including those related to privacy and security, as applicable.