Key takeaways:
- The past decade has been kind to investors, but the next 10 years will demand fresh thinking to navigate structural shifts reshaping the global economy
- We've identified 10 investment themes that could help future-proof portfolios in the event of a regime-change rupture
- In part one, we introduced the first five: gold miners, Japanese corporate governance, oil & gas services, defence, and infrastructure. In part two, we’ve added five more: demographic shifts, uranium, India, automation, and electrification
They say The Godfather and Top Gun are two rare examples of the sequel being better than the original. Hopefully, this too, improves on Part One1. The bottom line is simple: if you can truly weather the noise of a 10-year timeframe, what are the 10 best ideas to capitalise on?
Before diving into the next five themes, I want to address one piece of criticism I received after the first instalment. That argument went: if you have 10 themes, and, say, five to 10 names within each theme – you end up with between 50 and 100 stocks – surely, you’ve just bought the market? The short answer is no. To illustrate, the conclusion of this paper runs through a prototype ‘10 for 10’ portfolio. We’re still in the early stages of shaping this as a strategy, and thus the 95 (!) names we’ve selected will be pared down considerably over time. But even with this wide starting point, when we put it through our portfolio construction tech, we see a tracking error of over 7% against MSCI World.
So, no, it’s not the index. In terms of tilts, we see skews away from Cross-Sectional Momentum, Semiconductors, Internet Services, and the US. On the other hand we see tilts toward small- and mid-cap stocks (SMID), Asia, Canada, Oil & Gas and Gold. Plus, around 140 basis points of idiosyncratic relative risk.
This may turn out to be better or worse than owning an MSCI World tracker, but ‘the same’ it is not. Now, time gentlemen, please.
1. Ageing demographics
“Thou shouldst not have been old till thou hadst been wise” says the Fool to Lear. The trouble, for individuals and populations alike, is that by the time you realise you’re old, it’s usually too late.
This is one of those topics where the challenge is choosing only the most striking statistics. Here are three:
- The old-age dependency ratio (those over 65 as a percentage of working-age people) for the ‘Group of 20’ nations has risen from 14% in 2000 to 22% today, with a four-point increase in the last four years alone.
- United Nations (UN) forecasts suggest Europe will lose 13 million working-age people in the next five years.
- And the momentum for some key countries is to the downside. In 2019, the UN estimated China’s working-age population by the end of the century would be 600 million. In 2022 it re-ran the numbers and came up with 400 million.
Notwithstanding, there is the challenge that, unlike the other themes discussed in this note and its prequel, the cui bono is harder to pinpoint. If gold truly becomes an alternate reserve, those who mine it should have healthier top lines. If 5% is the new 2% on defence spending, then those who make arms should sell more of them. But if older communities grow disproportionately large… then what? This is a legitimate criticism.
But I am confident in three outworkings:
- First, end-of-life care infrastructure is critically inadequate and will require substantial investment. Goldman Sachs estimates that the number of nursing facility beds per 100 inhabitants for Italy, Germany and France are 0.5, 1.2 and 1.0. That is clearly insufficient for countries with dependency ratios of 41%, 38% and 39%. The chart below shows how just 2% of the US over-65 population lives in an assisted living facility. I reckon that number may grow as the average age within the over-65 segment rises.
- Secondly, the older age cohort will likely have specific and expensive healthcare needs. Today, the World Health Organisation (WHO) estimates that personal healthcare spend per capita for those over 60 is 2,400% higher for cardiovascular disease compared to those under 45. Similarly, spending is 970% higher for neurological disorders, 580% higher for neoplasms, 570% higher for musculoskeletal disorders and 550% higher for diabetes. These are, sadly, growth areas.
- Finally, there are particular areas of leisure which cater to a more wizened clientele. Cruises are perhaps the most pertinent example. Despite the industry making much of a drop in passengers’ average age,2 my view is that the nature of the experience (not least due to the time it takes) will mean that its core customer base remains anchored in older generations.
Figure 1: Living situations for US individuals 65+ (2021)3
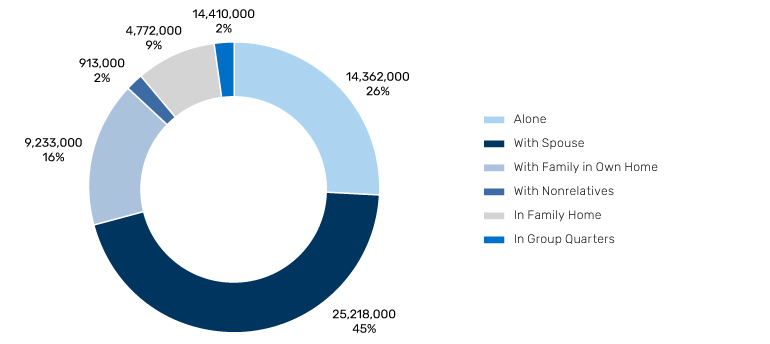
Source: Goldman Sachs, Joint Center for Housing Studies of Harvard University, US Census Bureau 2021 American Community Survey 1-Year Estimates. Reproduced with kind permission from Goldman Sachs, whose work on this topic has been seminal to my thinking.
2. Uranium
This one is beloved of the fintwit community, so one shouldn’t dismiss the froth risk. When even Jim Cramer warns that a market might be getting carried away with itself4 a degree of caution is warranted. As I’ll discuss further in the conclusion, few of these themes come cheap, which inherently brings drawdown risk from near-term disappointments. But over a decade-long horizon I find the investment case compelling.
Even at current production levels, the world is running at a structural supply deficit of between 20 -30 million pounds a year. Moreover, uranium accounts for only about 10% of a nuclear reactor’s total cost, compared to roughly 80% for a coal- or oil-fired plant. Therefore, the appeal of uranium producers is rooted far more in ensuring stability of supply than in sensitivity to price fluctuations.
Moreover, the climate lobby has, in my view, almost completed their transition from seeing nuclear as ‘bad’ to ‘good’. You know you’re no longer persona non grata among the cognoscenti when Oliver Stone makes an adoring film about you.5 The UN’s Conference of Parties’ (COP) ambition to triple global nuclear power production from some 400 gigawatts per annum today, to 1,200 gigawatts by 2050, underscores this transition. Achieving the goal would mean annual uranium demand rising from some 200 million pounds today, to 600 million pounds over the next 25 years.
These structural supports are further reinforced by recent geopolitical turbulence, as much of the supply comes from unstable regions : until recently, Russia supplied around a fifth of America’s raw-uranium needs. It no longer does – at the end of last year the US enacted a ban on importing raw and enriched uranium from Russia. There is some debate around the level of support that can be expected from the new US administration, especially given President Trump’s equivocations during his interview with podcaster Joe Rogan.
That said, Trump’s energy secretary, Chris Wright, sits on the board of Oklo, a developer of nuclear fission reactors, while Treasury secretary Scott Bessent, along with prominent Trump allies Elon Musk and Peter Thiel, have all commented favourably on nuclear energy.
3. India
The perennial debate with this one is that impressive fundamentals come at a cost. And one can argue that this balance is currently looking a bit off. Figure 2, inspired by a similar chart from Morgan Stanley, plots the major global equity markets by expected price-to-book ratio (P/B) against return on equity (ROE). On this basis, India, marked in orange, hardly stands out as a screaming buy. But, if we look at it with our corporate finance nerd hat on and dive into the DuPont components, I think there’s a good case for optimism.
In my view, India’s ROE is lower than it should be for its given multiple, largely due to current limitations on its capital market liquidity and corporate profitability; limitations that the market is pricing (correctly, in my opinion) will ease over time. While India’s asset turnover is strong (0.31 vs 0.23 for MSCI ACWI), this efficiency is not capitalised on because its companies are under-levered (financial gearing of 4.6x vs 5.7x for ACWI), and relatively unprofitable at an operating level (EBIT margin of 15.4% vs 16.4%).
I believe the former can change as the Indian middle class expands. The cult of equity thrives on this process, as we’ve seen in other geographies that have undergone this transition. And India is still relatively early in this journey. Its urbanisation rate, for instance is just 35%, at a similar level to China’s at the start of the 21st century. Stocks represent just 6% of household assets (property is 51%, cash is 16%, gold is 15%). But there are promising signs that this is starting to change. Notional option turnover has increased tenfold over the last four years, a classic sign of accelerating retail participation. Meanwhile, the absolute number of stockholders is already significant, by some estimates they represent the second-largest voting cohort after farmers. No doubt, politicians will be taking note.
In our last note we picked physical infrastructure as a 10-year theme, and the case for it is particularly evident in India. The need is significant. For example, the country boasts 15% of global internet users (900 million people, second only to China and more than double the US), yet it only has 6% of data centre capacity. India’s government has begun addressing this and other infrastructure gaps increasing central capital expenditure (Capex) from Rs3 trillion in 2020 (2% of GDP) to 11 trillion today (3.5%).
What’s more, despite its strong performance, many international investors remain underweight India. This is partly due to the passive implication of India’s growing weight in global benchmarks. In 2020, it was little more than 5% of the MSCI EM benchmark. Today it is 19%.
Figure 2: Valuation vs ROE, various geographies (size of circle = market capitalisation)
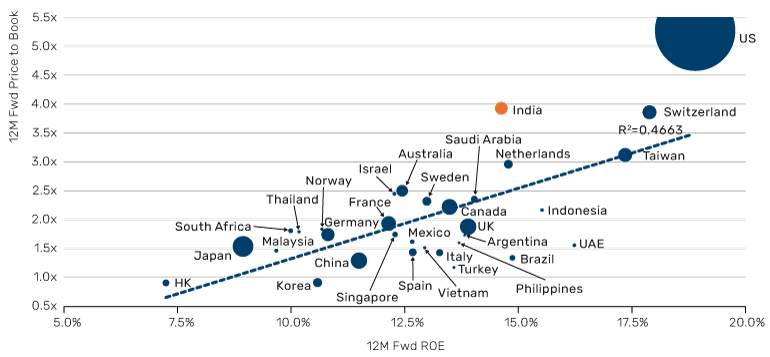
Source: Man Group data, inspired by Morgan Stanley, as at 31 December 2024.
4. Automation
Those who have followed these missives for a while will know that I’m on the sceptical side of the ‘will AI revolutionise productivity tomorrow’ debate.6 And, frankly, in terms of short-term implications, my views haven’t changed much. My (embarrassingly simple) Bloomberg helpdesk queries still get (sort of) answered by a human being. Last week I spent an hour and a half on the phone to HMRC waiting for an actual human. So spare me on the robots conquering the call centres in 2025. Moreover, in the early ChatGPT days the narrative was that it takes 18-24 months from innovation to killer app. So, just you wait. Well, by my count it’s now 26 months, and it doesn’t feel to me like it’s in the back of the net.
So, all of which is to say, I can certainly imagine 2025, as is rumoured, being the ‘show-me-the-money’ year for all this AI capex, I can equally imagine the results disappointing the market. With valuations extended, no matter which way you slice it, that could result in some vertiginous declines. Then again, remember the Amazon lesson: if you had bought the stock at the end of 1999, you were looking at a -94% return over the next two years. From the same starting point your return to the end of 2024 was more than +4,000%.
Clearly, the validity of this analogy depends on the long-term opportunity being real. And on that front, I’m convinced that this long-term opportunity is enormous. I’ve been playing around with Gemini Deep Research this month and I find the results pretty staggering. The ease with which one can create the kind of glossy 30-page research report which, today, McKinsey might spend months on, is highly impressive. It’s not there yet, there are still hallucinations, and perhaps there’s not quite the final leap of imagination with takes it from a 7/10 to a 10/10. But we are close.
It’s helpful to be reminded of the very long-term trajectory of productivity, as shown in Figure 3: today’s efficiency levels are near 100-year lows, trailing the historical peaks of 4–5% by over four percentage points. Back-of-the-envelope calculations suggest that closing this gap on a global scale could unlock nearly $5 trillion in value. The Scotsman in me doesn’t like the valuation. The cynic in me doesn’t like the near-term hype. But given the size of the opportunity, a 10-for-10 portfolio has to have an allocation.
Figure 3: UK productivity growth over the (very) long term
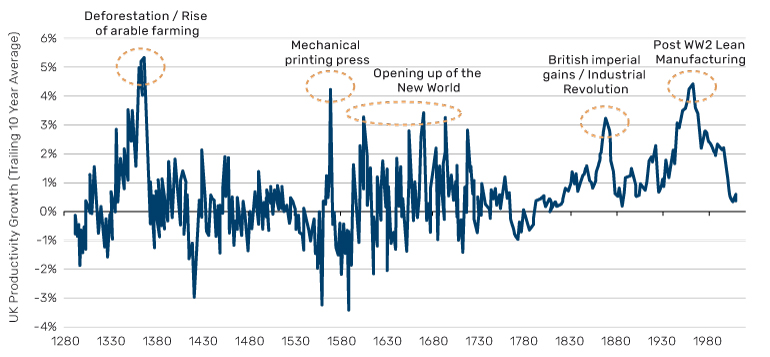
Source: Bank of England Millennium of Macroeconomic Data. Note that prior to 1760 we make the (perhaps overly) simplifying assumption that employment as % of population stays constant at 71%, the 1760-1780 average.
5. Electrification
My colleague Charlie Long talks about the nexus of three forces that current grid operators and related businesses sit within:
- Hitting environment targets
- Increasing energy security
- Allowing AI to have a business model
I find these drivers persuasive. Meanwhile, it’s not just populations that are getting older. The average age of the US regional grid is 40 years. For Europe it’s 50. Electric and hybrid cars now account for 56% of new EU registrations, a figure which has been climbing rapidly.7A single ChatGPT query uses around 2.9 watt-hours (Wh) of electricity, roughly 10 times an equivalent Google search. The defenders might claim you are getting more than 10 times the bang for your buck, but even if that’s true, the electric buck is still getting paid. According to the LBNL 2024 US Data Center Energy Usage Report, data centres in the US currently consume 200 terawatt-hours (TWh) of energy annually, projected to rise to between 300 TWh and 575 TWh over the next three years alone.
In the UK, National Grid’s £7 billion rights issue wiped 20% off its share price in May last year. But in one sense, it was just revealing the scale of the opportunity. A capital raise from a legacy, defensive name is an albatross around its neck. For a promising growth stock it is a spring in the step. In my view, electric utilities are swapping sides.
The cost of futurism
We’ve mentioned several times that these spaces don’t come cheap and Figure 4 provides a quantitative demonstration of this. The table maps 10 statements to the 10 themes discussed in this paper and its prequel. It’s worth noting a few things.
First, this is an early-stage crude filter, a first pass as we seek to narrow down the best stocks to capitalise on these themes. As discussed in the introduction, our final list will likely be much shorter. Secondly, we are attempting to lean toward the specific characteristic of each theme that we have outlined in the two notes. For example, the India segment tilts toward those names most exposed to centralised capex and a growing domestic middle class.
Now to a more fundamental observation. Only two out of the 10 are trading at a P/E percentile below their historic median, Gold Miners (USD decline) and Oil & Gas Services(energy squeezes). Six out of the 10 are in their top quartile. We all know that valuation is a poor timing metric. But in my view, it is a good indicator for drawdown potential (even if it never ends up being realised).
There’s no shame in having a 12-month timeframe – we all have liquidity needs. The shame(read, loss) is in not admitting it. So be honest with yourself: if you don’t have a 10-year view, this note is little more than a curiosity. But if you are that rare bird — a genuine lesser spotted long-term investor —then insurance for the future is expensive but necessary. Or, to put it into options-nerd terms, there is a value to theta.
Figure 4. 10 themes with valuation and relative performance of a representative basket
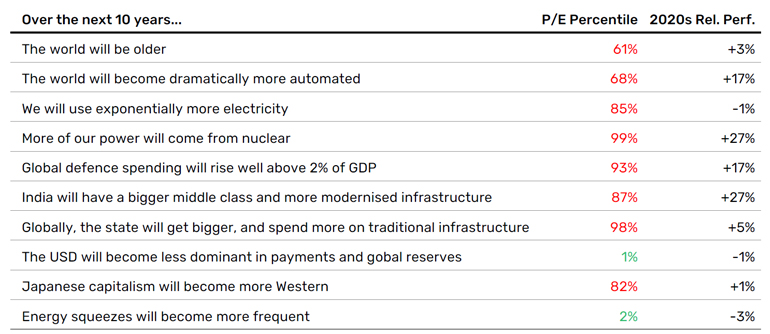
Source: Bloomberg, Man Group for the period as at 31 December 2024. P/E Percentile is calculated based on a trailing 10Y lookback. 2020’s relative performance is against MSCI World TR. Performance analysis has been conducted on representative baskets we selected across the 10 themes: Ageing Demographics, Automation, Electrification, Nuclear, Defence, India, Infrastructure, Gold Miners, Japan Corp Gov Reform Beneficiaries, Oil & Gas Services. This analysis is based on our research and is intended for illustrative use based on considerations listed in this paper and should not be construed as a recommendation and should not be relied on.
1. https://www.man.com/insights/road-ahead-ten-themes
2. See, for instance, https://www.independent.co.uk/travel/news-and-advice/cruise-passenger-average-age-b2629487.html
3. Source: Reproduced with kind permission from Goldman Sachs, whose work on this topic has been seminal to my thinking.
4. https://finance.yahoo.com/news/jim-cramer-says-nuclear-power-163910679.html?guccounter=1
5. See https://www.nuclearnowfilm.com/
6. See, for instance,https://www.man.com/insights/road-ahead-is-AI-overhyped
7. Source: Bloomberg. Covers period from 1925 to 2023.
You are now leaving Man Group’s website
You are leaving Man Group’s website and entering a third-party website that is not controlled, maintained, or monitored by Man Group. Man Group is not responsible for the content or availability of the third-party website. By leaving Man Group’s website, you will be subject to the third-party website’s terms, policies and/or notices, including those related to privacy and security, as applicable.