Key takeaways:
- Cryptocurrencies offer fertile ground for trend-following due to their inherent liquidity, volatility and lack of fundamental valuation anchors, which lead to pronounced trends
- With limited diversification between coins, our anaysis shows that peak risk-adjusted returns in a trend-following crypto portfolio occur with around 10-15 coins
- Beyond this point, transaction costs and liquidity constraints outweigh diversification benefits
Introduction: The psychology of trends
Behavioural finance has long extolled the dangers of emotions, namely fear and greed, in investing. This is largely owing to the significant impact these emotions can have on decision making, leading investors to hold onto losing positions for too long or enter rising markets too late. Cognitive biases, like herding – the tendency to imitate the group – and confirmation bias, which describes the propensity to interpret new evidence as confirmation of one’s existing beliefs, can further exacerbate these trends.
These behaviours can mean that investors are slow to react to new information, in turn creating opportunities for trend-following strategies. As regular Man Institute readers will well know, trend-following systematically exploits sustained price movements through buying appreciating assets and selling depreciating ones.
In this paper, we will argue that cryptocurrencies present an opportune market for trend-following on account of their liquidity, volatility and speculative nature, which can create pronounced trends. Unlike traditional markets, where fundamental analyses tend to provide a valuation anchor, cryptocurrency valuations have less fundamental support and fluctuate widely, providing opportunities for trend-following approaches to thrive. With that said, cryptocurrencies have unique characteristics which must be understood as models cannot be transferred directly without adjustment. In what follows, we explore how applying trend-following to cryptocurrencies works in practice.
Riding the crypto wave
At Man AHL, we have been trading across equities, rates, commodities and FX for many years. However, investors increasingly ask about nascent areas of markets, such as cryptocurrencies, namely whether they pose a challenge for trend-following, given their high volatility could lead to stronger reversals. In answering, we often point to freight markets, which are even more volatile than cryptocurrencies, yet have been part of our trend-following portfolios for several years. The key lies in volatility scaling, which helps us to manage volatility – both its absolute level and its non-stationarity (which describes how its statistical properties change over time). In essence, volatility scaling adjusts the invested exposure to the level of volatility, thus maintaining a stable level of risk. A side benefit is that transaction costs are typically reduced in periods of high market stress.
We believe this approach is equally as applicable to Bitcoin. Indeed, it could even be argued that Bitcoin is more ‘normal’ than equity markets. In our ‘Investor’s Guide to Crypto’, published in the Journal of Portfolio Management, we show that, once volatility is scaled, the left tails of Bitcoin are more benign than those of the S&P 500, thus making volatility scaling more effective. And thus, while volatility of volatility may no longer be the primary concern, our focus turns to diversification and liquidity.
Balancing diversification benefit and liquidity: How many coins to trend-follow?
Traditional trend-following benefits from trading a wide range of diversifying markets. In simple terms, the more markets you trade, the more likely you are to hit on a winning trend. This holds true as long as trading costs do not outweigh the expected benefits, which we will return to shortly. The key question is whether this core principle of diversification holds when trading a portfolio of trend-following strategies exclusively in cryptocurrencies.
Unlike traditional markets, cryptocurrencies are relatively concentrated and have a short price history, although the availability of high-frequency data goes some way towards offsetting the latter. While limited historical data hinders structural analysis of long-term correlations, shorter term high-frequency pairwise correlation analysis over the last decade shows an average of around 0.6, indicating limited diversification potential (Figure 1).
Figure 1: A coin high-frequency pairwise correlation shows a modest amount of diversification
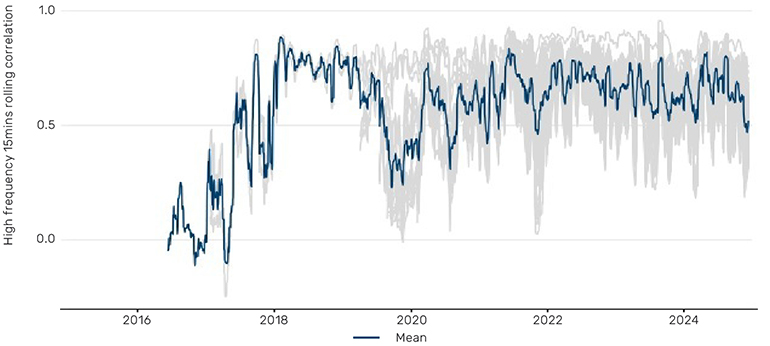
In this analysis, coins were included as they launched, given not all coins considered existed in 2016.
Source: Coinbase, as of 11 December 2024.
Does trading more coins enhance diversification, or is there a limit?
As trend-following practitioners, we know that the Sharpe ratio1 of an individual market is positive but small, so the diversification benefit gained from trading across multiple markets is the key parameter in enhancing risk-adjusted returns. What often gets ignored is the level of friction and transaction costs which detract from the overall risk-adjusted returns.
Below, using a simplified model of moving average crossovers (e.g. 200-day versus 50-day moving averages), we investigate where the balance between diversification benefits and trading costs lies in relation to cryptocurrencies. After a certain number of coins, transaction costs and liquidity constraints can begin to overshadow diversification benefits.
To determine the ideal number of coins in a portfolio, we start with a 100% Bitcoin portfolio and progressively add coins, sharing risk equally across coins. We then calculate the Sharpe ratios of the resulting portfolios, considering transaction costs, shorting costs, liquidity constraints and shorting availability.
Figure 2: The moving average cross over – Sharpe ratio versus ranked average daily volume (ADV)
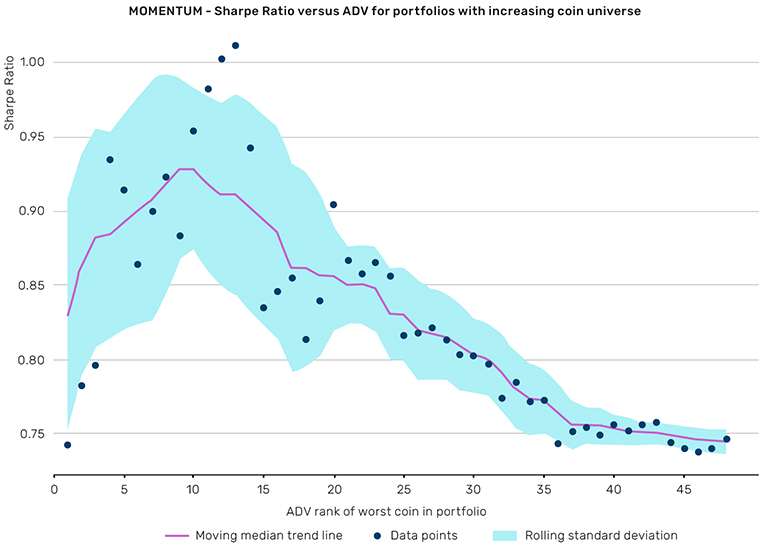
Source: Man Group, as 1 December 2024. Any descriptions or information involving investment process or strategies is provided for illustration purposes only, may not be fully indicative of any present or future investments, may be changed and are not intended to reflect performance.
Liquidity, while ample for the top 15 coins, starts to decline significantly thereafter, and slippage increases dramatically the further one ventures further into the altcoin market, referring to the market of less well-known cryptocurrencies with diverse purposes and technologies.
The results of this simplified model, shown in Figure 2, indicate that the optimal Sharpe ratio for a trend-following system occurs with around 10-15 coins. While the level of Sharpe ratio is higher than expected for a concentrated trend-following system (and is probably a function of the short history), a clear pattern emerges. Beyond a certain range, transaction costs start to outweigh additional diversification benefits, bringing down the overall portfolio Sharpe.
Diversification and the impact on faster technical models
Trend-following systems often incorporate not just moving averages but also a family of breakout strategies. Breakout models focus on entering positions when an asset’s price surpasses established resistance or support levels. These models are typically more reactive and generate a sharp binary signal which enters a full long or short position straightaway, thus requiring greater liquidity. Breakouts add a valuable element of crisis alpha, enabling these systems to react more swiftly to market changes.
For breakout models, we observe that the optimal number of coins is lower than with traditional moving average crossovers and lies at around 10 coins.
Figure 3: Breakouts – Sharpe ratio versus ranked average daily volume
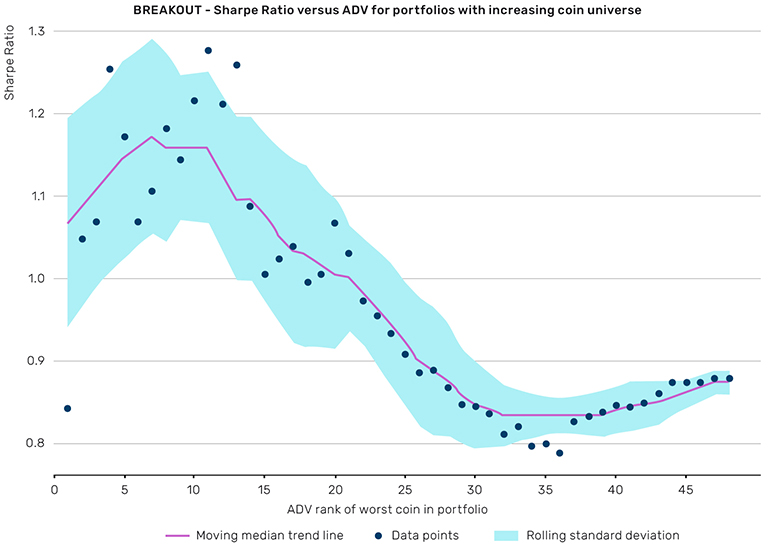
Source: Man Group, as of 1 December 2024. Any descriptions or information involving investment process or strategies is provided for illustration purposes only, may not be fully indicative of any present or future investments, may be changed and are not intended to reflect performance.
As a rule of thumb, given the diversification level of coins, more reactive models require a smaller number of coins to maximise the Sharpe ratio.
Conclusion
Our analysis is a simplified model with static, equal risk allocation. Real systems are much more complex, including time varying cost models and regime dependent signal speeds. While these elements add to the complexity of the model, they do not change our overall conclusion, namely that adding more coins is beneficial to performance, but only up to a point.
Our fundamental belief that trend-following, as well as other technical strategies, can be applied to cryptocurrencies remains. Further, we think cryptocurrencies present an opportunity, not only owing to their liquidity, but also their volatility and speculative nature. However, it is vital that investors understand the unique market characteristics of coins, as models cannot be transferred directly without adjustment.
1. The Sharpe ratio is a measure of the risk-adjusted return.
Bibliography
Harvey, C, R, Abou Zeid, T, Luk, M, Neville, H, Rzym, A, van Hemert, O. (2022), “An Investor’s Guide to Crypto”, Man Institute, Available at: https://www.man.com/maninstitute/investor-guide-to-crypto
You are now leaving Man Group’s website
You are leaving Man Group’s website and entering a third-party website that is not controlled, maintained, or monitored by Man Group. Man Group is not responsible for the content or availability of the third-party website. By leaving Man Group’s website, you will be subject to the third-party website’s terms, policies and/or notices, including those related to privacy and security, as applicable.