Key takeaways
- Investors in Japan face unique challenges due to the market’s value-centric nature and short-term price reversal patterns
- By leveraging alternative data for ‘nowcasting’, they can overcome these hurdles, identifying future outperformers and enhancing return predictability
- Our new Consumer Trend signal, derived from alternative data, has shown a statistically significant link to actual sales growth in Japan’s retail sector and outperforms traditional analyst-based strategies
Introduction
The Japanese stock market poses unique hurdles for investors, owing to its value-centric nature and lack of sustained trends, favouring short-term price reversal patterns that are often too costly to act on.
Traditional momentum strategies based on analyst forecasts struggle in this environment. While these strategies have been useful globally, they are less effective in Japan due to its unique market structure and investor behaviour. Analysts’ earnings and revenue forecasts, while informative, provide limited power in predicting returns, especially in the retail sector.
Fortunately, alternative datasets derived from sources like social media, satellite imagery, consumer surveys, and credit card records have become more accessible thanks to advances in big data technologies and analytics. These datasets can provide real-time, actionable insights into a company’s momentum.
The question for us was how we could harness these data sets to better predict Japanese retail stock returns? How could this form of nowcasting - using real time data coupled with advanced statistical models to predict market and sales trends - help our portfolio construction?
We developed a ‘Consumer Trend’ signal using credit card receipts, point-of-sales data, and customer surveys to predict sales growth more accurately. This unearthed a statistically significant link between Consumer Trend scores and actual sales growth.
We found this nowcasting tool was specifically suited to address the challenges of predicting returns of Japanese retail stocks.
In this paper, we outline our methodology for developing the Consumer Trend signal and showcase its effectiveness through a case study and statistical analysis.
Bucking the trend on reactions to revenue growth
Although investors consider multiple factors when assessing the fair value of a security, unsurprisingly, sales growth matters.
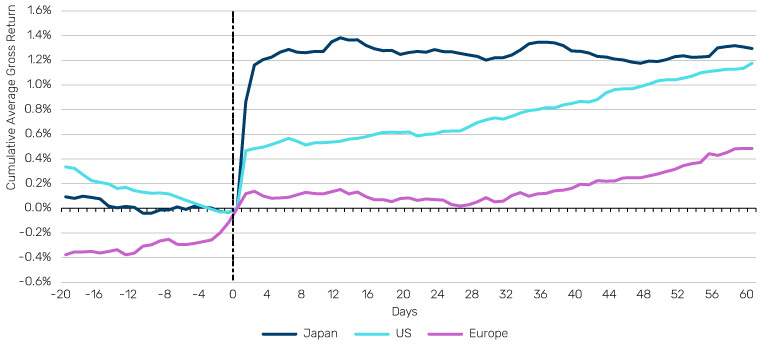
Figure 1 highlights the average stock price move for companies reporting year-over-year quarterly sales growth (‘Sales Growth’) above 10% and below -10% in the US, Europe and Japan.1
It is worth noting that, as the economic landscape differs between regions, sales growth is not directly comparable and the relative regional magnitude of the price reaction is not the most relevant here. However, the stock-price trend after the initial reaction gives us some important insights, with an obvious pattern difference in Japan, especially for companies reporting positive sales growth.
Figure 1. Average return around announcement date (T-0)
Companies reporting sales growth above 10%
Companies reporting sales growth below -10%
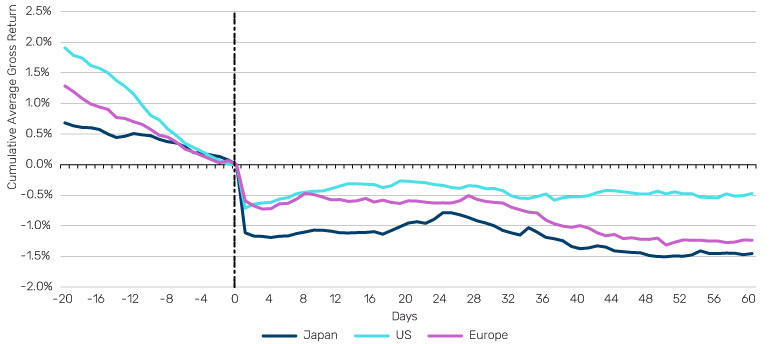
Source: Compustat, Worldscope, I/B/E/S, Man Numeric; Period: Q1 2015-Q4 2023; The displayed return is the cumulative sector-relative return, indexed at 0 on announcement date (T-0).
After earnings announcements, stock-price movements in the US and Europe align with known investor biases such as conservatism (underreacting to new information) and overconfidence (overreacting to new information). Stocks with high reported sales growth usually jump in price on the announcement date, while those with low sales growth drop. These prices then continue to drift in the same direction for the rest of the quarter, allowing investors to benefit from this drift even if they miss the initial price move.
However, stock prices don’t show quite the same pattern in Japan, with very little drift and even reversal, after the first price move, indicating that investors react differently to new information. There is no one explanation for this. One possible reason could be the established practice of disclosing earnings guidance for the next fiscal period.
There is also an argument that investor psychology may be different in Japan. Alternatively, one can look to macroeconomic-based theories to explain the phenomenon (Chordia and Shivakumar 2002), looking at differences in business cycles and macro conditions such as the yield term structure to explain the divergence.
Our goal here is not primarily to identify the drivers of this regional divergence, but instead explore how to effectively predict revenue growth to capture some of the initial stock price reaction.
Analyst behaviour is consistent across regions
Investors can leverage analysts’ expertise to gain important insights into a company’s business momentum and help predict earnings or revenue growth. But with analyst research so widely available now, is this still the foundation of a profitable strategy?
We tried to test this. Focusing on sales estimates, we built an analyst diffusion crosssectional score (‘Sales Trend’), calculated as the recency-weighted number of upward analyst sales revisions minus downward revisions, scaled by the total number of estimates, for each security in the three universes. The raw score is then standardised to have a mean 0 and a standard deviation of 1 in each universe.
In most markets, regulations now prevent analysts from obtaining and disclosing material non-public information.2 Therefore, they need to leverage the information shared by management during earnings calls, including realised sales growth and company guidance, to steer their estimates for the upcoming fiscal periods.
As such, analysts typically update their estimates immediately after the earnings announcement, not before. This is shown by the Sales Trend signal, which only changes significantly after the announcement (see Figure 2). From this perspective, analyst behaviour seems consistent across regions.
Figure 2. Timing of earnings revisions
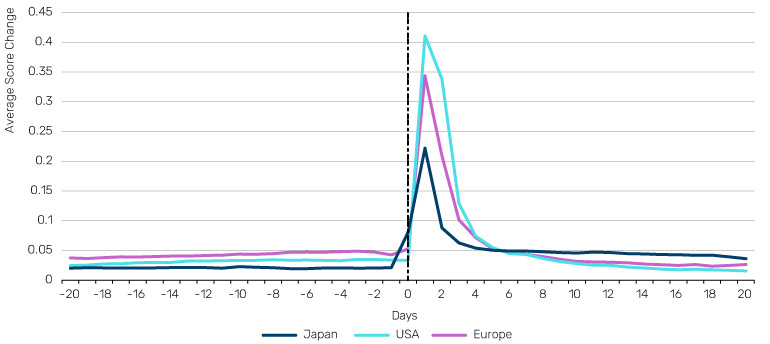
Source: I/B/E/S, Man Numeric; Period: Q1 2015-Q4 2023.
Analysts can effectively predict revenue growth…
Analysts aim to provide their clients with precise estimates to offer early insights. But how accurate are these predictions? Again, we put it to the test.
Using the previously defined sales growth metrics, we ran a fundamental cross-sectional regression of company-reported sales growth on the sales diffusion score (‘Sales Trend’) for each quarter in the sample period. By averaging the quarterly estimated coefficients, we obtained the average company sales growth and the sales growth premium associated with one unit of the Sales Trend standardised score (Figure 3).
We then tested the significance of those coefficients (t-statistic) to confirm the linkage between the two. Analysts’ predictive skills on sales growth do measure up. Analysts, on average, predict the relative strength of a company’s sales growth, with a statistically significant relationship in Japan, the US, and Europe.
In Japan, the average year-on-year quarterly sales growth was 7.5% over the period (2015- 2023), with each unit of Sales Trend accounting for 5.8% additional growth.
Figure 3. A fundamental linkage exists between the sales trend and sales growth
Sales Growth = β0 + β1 Sales Trend + ϵ
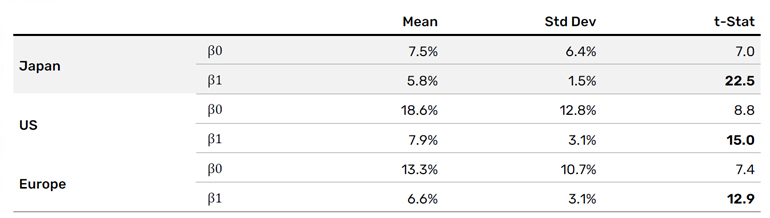
Source: Compustat, Worldscope, I/B/E/S, Man Numeric; Period: Q1 2015-Q4 2023.
…..but a trading signal based on analyst revisions is largely ineffective in Japan
Having established the fundamental linkage, the question now is whether the signal is actually useful. The fit of the cross-sectional regression remains very low, with an average quarterly R² between 2.5% and 8.5% in all three regions over the period. This means that the Sales Trend has, on average, predicted less than 8.5% of the variation in sales growth.
Additionally, as information becomes more accessible, the efficacy of the sales trend score as a trading signal is expected to decay over time due to arbitrage. Unsurprisingly, the trend is indeed negative for the Sales Trend in the past decade (Figure 4). While this decline is observed across regions, the efficacy of the signal has been significantly lower in Japan, often not offsetting the transaction costs required to implement such a strategy.
Figure 4. Waning payoff of the Sales Trend score3
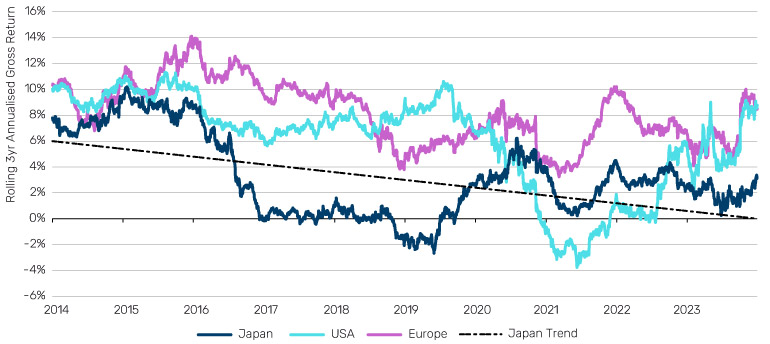
Source: Man Numeric.
The rise of alternative data in Japan
The efficiency of investment signals based on analyst estimates is generally poor across sectors in Japan, and consumer-oriented industries are no exception. Fortunately, alternative datasets, derived from non-traditional sources such as social media activity, satellite imagery, consumer surveys, or credit card records, have proliferated with the progress of big data technologies and advanced analytics in recent years. Driven by the increasing digitisation of consumer behaviours and the continuous search for untapped data, these datasets can allow for more accurate demand forecasting and trend analysis.
We built an alternative data-based signal (‘Consumer Trend’), leveraging credit card receipts, point-of-sales information, and customer and store surveys to nowcast sales growth. Each security in the Man Numeric Japan retail universe4 is ranked from highest to lowest trend in implied sales from each data source, then combined into a single score. The first step is to confirm the fundamental linkage between the Consumer Trend and actual sales growth by running the previous regression again, with Consumer Trend as an additional term.
Figure 5. Fundamental linkage exists between Consumer Trend, Sales Trend and Sales Growth
Sales Growth = β0 + β1 Sales Trend + β2 Consumer Trend + ϵ
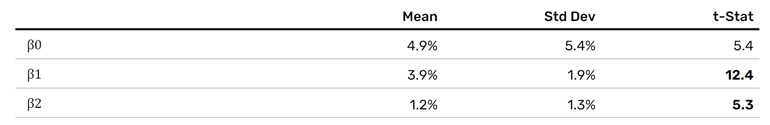
Source: Worldscope, I/B/E/S, Man Numeric.
The fundamental linkage between sales trend, consumer trend and sales growth is again statistically significant. Average year-over-year sales growth was 4.9% for the period over the Japan retail universe, with one unit of the Sales Trend standardised score accounting for 3.9% of additional growth and one unit of the Consumer Trend standardised score accounting for 1.2%.
Case Study: Identifying future outperformers ahead of announcement dates
The key advantage of the Consumer Trend signal is that sophisticated investors can now typically extract information from alternative data sources in a matter of days, providing much more timely insights into a business’s sales compared to an analyst estimate.
As such, leveraging this data can help investors identify future outperformers ahead of announcement dates.
Our case study of a Japanese company operating department stores throughout the country proves our point. The company reported positive quarterly results, including 6% year-over-year quarterly sales growth, for the fiscal period ending in December 2023 on February 2nd, 2024.
The Sales Trend score of this security only turned positive after the company reported,5 indicating that analysts revised their estimates following the announcement when the company raised its revenue guidance.
On the other end, the Consumer Trend signal was able to predict the positive sales growth of the company ahead of the February announcement date, which could have potentially helped investors capture the positive post-announcement stock price move.
Figure 6. Case study – Company operating department stores
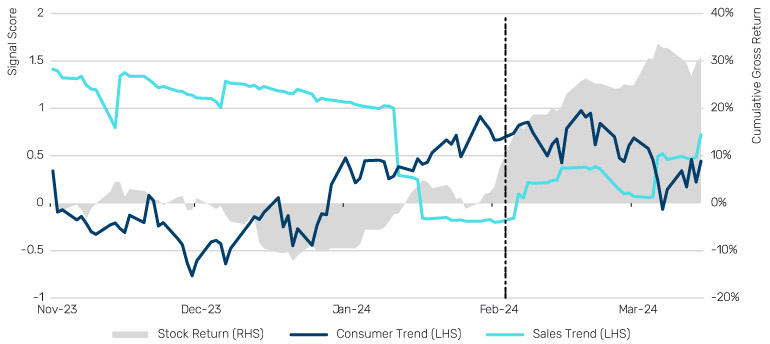
Source: Bloomberg, I/B/E/S, Man Numeric.
The final step is to confirm whether the Consumer Trend score can help predict stock returns. Focusing on the top and bottom securities of the retail universe, ranked by signal score,6 Consumer Trend looks particularly effective around announcement dates in capturing stock price moves, compared to Sales Trend.
The returns profile of the Sales Trend score around announcement dates is not surprising considering the historical return of the signal shown in Figure 4. The signal cannot effectively differentiate securities with positive/negative stock returns. On the other end, the Consumer Trend signal shows a clear divergence between winners and losers, benefitting from the jump/drop in stock price right after announcement date.
Figure 7. The Consumer Trend score helps capture stock price moves
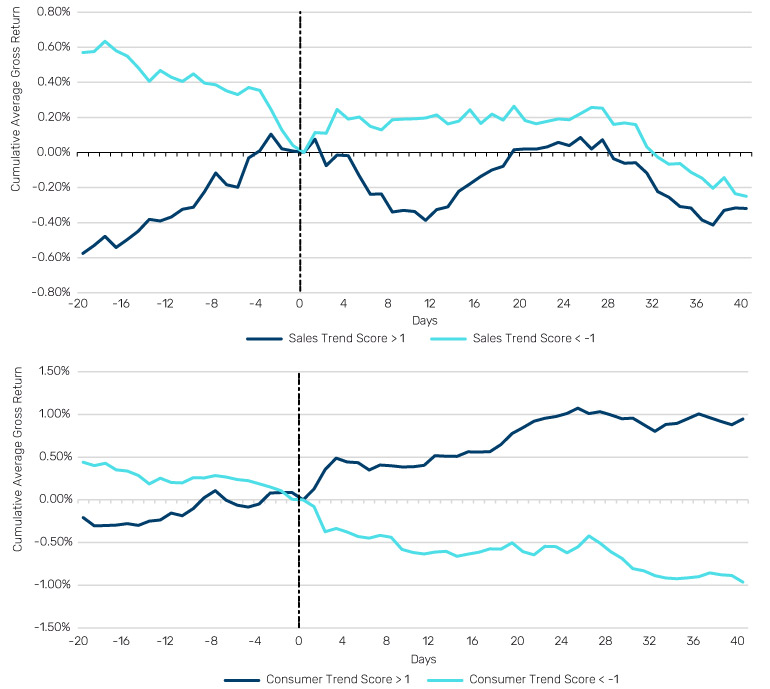
Source: I/B/E/S, Man Numeric; Period: Q1 2015-Q4 2023; The displayed return is the excess sector-relative return.
Conclusion: Generating useful insights for Japanese investors
Alternative data isn’t unique to Japan. Yet it addresses a specific problem here: the poor performance of traditional trend-following strategies based on analyst revisions. By predicting sales growth in consumer-focused industries, these datasets offer real-time, actionable insights into a company’s momentum. This could be a game changer for investors in Japan.
1. Man Numeric US universe (3,200 securities as of December 31st, 2023), Man Numeric Europe universe (1,800 securities as of December 31st 2023) and Man Numeric Japan universe (1,800 securities as of December 31st 2023).
2. U.S. Securities and Exchange Commission’s Regulation Fair Disclosure (Reg FD), effective in the US since 2000. European Union Market Abuse Directive (MAD), effective in Europe since 2004-2007. Japan Securities Dealers Association (JSDA) guidelines, effective in Japan since 2016.
3. Rolling 3-year average of daily model spreads (annualized return). Model spreads are instantaneously rebalanced, sector-neutral and do not reflect transactions costs or fees. Model spreads do not represent the performance of any Man Numeric portfolio or product. The model spreads shown are long-short quintile model spreads, where we take the average return of the top 20% ranked names and subtract the average return of the bottom 20% ranked names and display the difference, for each universe.
4. Man Numeric Japan retail universe covers roughly 230 securities in the following industries/subindustries as of December 31st, 2023: Multiline Retail, Specialty Retail, Restaurants, Food & Staples Retailing excluding Food Distributors.
5. Sales Trend score is industry-neutral. A 0 score is average. A positive score indicates above-average analyst sentiment. A negative score indicates below-average analyst sentiment.
6. Cutoff is based on the Sales Trend and Consumer Trend standardised model scores being higher than 1 (top 15.9% of observations) or lower than -1 (bottom 15.9% of observations). The score has a mean of 0 and standard deviation of 1.
All data Bloomberg unless otherwise stated.
You are now leaving Man Group’s website
You are leaving Man Group’s website and entering a third-party website that is not controlled, maintained, or monitored by Man Group. Man Group is not responsible for the content or availability of the third-party website. By leaving Man Group’s website, you will be subject to the third-party website’s terms, policies and/or notices, including those related to privacy and security, as applicable.