Introduction
As Geoffrey Chaucer first pointed out with ‘all good things’, trends too must eventually come to an end. We certainly saw that in March, with the prevailing ‘risk-on’ sentiment shifting abruptly during the month in the wake of the mini-banking crisis that ensnared Silicon Valley Bank (SVB), First Republic, Signature Bank, and Credit Suisse among others.
Leading up to this market turmoil, most trend-followers were latching on to the positive market sentiment which began in November 2022, driven by the combination of a more dovish US CPI print and China reopening. For example, yields on the US 2-year Treasury note went from 4.1% in October 2022 to 5.1% on 8 March 2023 before tumbling to 3.9% over the course of just three trading days.1 Remarkably, the US 2-year Treasury note yield saw its largest daily move since Black Monday of October 1987 (Figure 1).
Figure 1. 2-year US Treasury Yields Saw Their Biggest Daily Decline in 30 Years
Problems loading this infographic? - Please click here
Source: Bloomberg; as of 10 March 2023.
Alongside the US 2-year yield, several other notable risk-on trends ended in mid-March as they incurred losses including long equities, long credit and short fixed income markets (Figure 2).
Figure 2. Market Prices Ahead of SVB Collapse, Returns Normalised and Rebased as of 9 March 2023
Problems loading this infographic? - Please click here
Source: Man Group database; 9 September 2022 to 24 March 2023.
Does History Repeat?
Framing March’s reversal in historical context may provide insight as to how trend-following might behave in the coming months.
On this basis, we plot the five worst five-day drawdowns of the SG Trend Index since January 2000 (Figure 3). Relative to these instances, March 2023 is ranked second worst, with only the stock rout of March 2007 more severe.
Figure 3. Trend-Following Returns 12 Months Pre- and Post-Reversal
Problems loading this infographic? - Please click here
Source: Man Group database and Société Generale; January 2000 to March 2023.
The notable takeaways are two-fold; firstly, on average, trend-following is profitable in the twelve months leading up to a reversal. This is intuitive; by definition, a significant reversal must happen after a sustained trend. Secondly, in the twelve months that follow, on average performance supersedes the high-water mark which was set at the peak immediately before the reversal.
While trend-following seldom profits from reversals, the above examples show that it can roll with the punches and ultimately recover.
How Do Reversals Affect Performance on the Year?
To dig a bit deeper into the nature of trend reversals, we consider large outlier months of performance for both the S&P 500 and the SG Trend Index and compare them alongside the year-end returns for each index. Interestingly, different patterns emerge. For outliers we have selected months where either index was down more than half of its annual standard deviation to allow the comparison to be relative. The SG Trend Index has an annual standard deviation of 13.6% since inception in Dec 1998 while the S&P 500 index has an annual standard deviation of 15.4% over that same time-period. This means we monitored for severe outlier months of -6.8% for the SG Trend Index and -7.7% for the S&P 500.
Figure 4 shows that in years when SG Trend faces a ‘severe month’, it does not necessarily indicate that the year-end result will be severe or even negative. In fact, most of the years which saw a severe month ended up positive overall. It is also notable that the mean and median annual returns in years with severe months are positive.
Figure 4. Comparing 'Severe Months' and Year-end Returns in the S&P 500 and SG Trend Indices
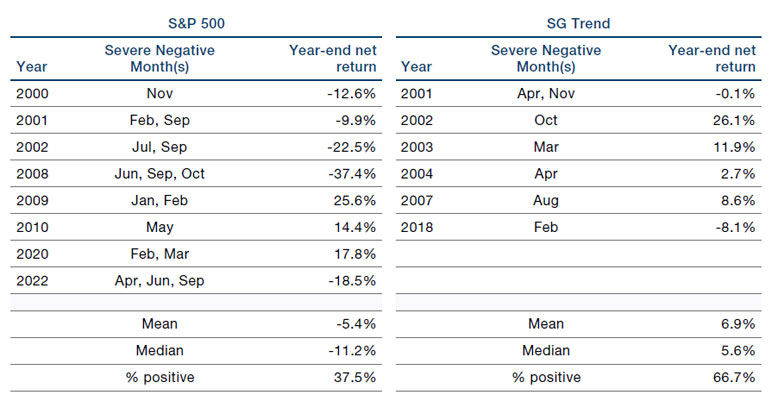
Source: Man Group database. Date range, December 1998 to February 2023.
The same, however, cannot be said of the S&P 500. In years when it experiences severe months, it is much less likely to finish the year positively and the mean and median year-end returns are both negative. It is also notable that the S&P 500 has six years where multiple severe months occur whereas with SG Trend we see only one year with multiple severe months.
In short it does appear that the trend-following index is able to contain large outlier losses better the S&P 500. This may be in part due to trend-followers’ ability to reduce exposure following volatility spikes, as we discuss below, as well as their ability focus on new trends that develop after price reversals.
Scaling and Waiting
When faced with a reversal, risk management is key to mitigate losses and ensure that a strategy is suitably positioned both during and after. A core tenet of this is the inverse scaling of positions within each market by that market’s volatility. It follows that when market volatility spikes relative to history, positions are cut accordingly (and vice versa). Naturally, positions will also be cut as the trend signal itself changes, but (inverse) volatility scaling tends to be the most immediate mechanism in a crisis.
Conclusion
The question of whether it is worthwhile investing in trend-following invariably arises when exposures are reduced following a sharp reversal. Of course, if markets rebound you won’t capture much of the upside. The opposite also holds true, however; if the reversal deepens, you will likely be more insulated against the downside and further losses should be minimised. By adopting this ‘wait-and-see’ stance, the strategy is less prone to being whipsawed during a period of heightened volatility where the length of trends can be vanishingly small.
A further benefit of this is that the strategy retains flexibility to roll with the punches and is uniquely poised to re-establish positions irrespective of whether the prior trend resumes or a new one emerges. This flexibility is derived from the key principle of trend-following, that it is directionally unbiased and can take both long and short positions across all markets traded.
1. Source: Bloomberg.
You are now leaving Man Group’s website
You are leaving Man Group’s website and entering a third-party website that is not controlled, maintained, or monitored by Man Group. Man Group is not responsible for the content or availability of the third-party website. By leaving Man Group’s website, you will be subject to the third-party website’s terms, policies and/or notices, including those related to privacy and security, as applicable.