Deja-vu all over again
In April this year, following the collapse of Silicon Valley Bank (SVB) and the market reversals that caused losses for trend-followers, we looked to history to see if there might be clues to trend-followers’ subsequent performance. To do this, we plotted the five worst five-day distinct drawdowns of the Société Générale (SG) Trend Index since January 2000 (Figure 1), aligned at the pre-reversal point, and extending backwards and forwards 12 months.
Figure 1. Trend after a reversal - Performance in the 12 months prior to and post a reversal
Problems loading this infographic? - Please click here
Date range: 1 January 2000 to 30 September 2023. Source: Man Group database and Société Générale.
Trends invariably re-emerge following a reversal with trend-following strategies typically recouping losses within six to 12 months.
The pattern that emerged was revealing. Firstly, reversals, by definition, occur at the end of a trend; with an average return, denoted by the burgundy line, of over 20 percent in the 12 months prior to the trend peak. Secondly, losses around the reversal are broadly well contained; this is trend-following behaving as it should, with models quickly reacting to close out positions. Finally, and perhaps most importantly, trends invariably re-emerge following a reversal with trend-following strategies typically recouping losses within six to 12 months.
This pattern should hopefully instill confidence in trend-following; however, does it hold true for March’s SVB induced reversal? This is plotted as the blue line in Figure 1, centred on the peak of 9 March, 2023, and includes returns through to 30 September, 2023. The results, at first glance, are encouraging as it appears that history may well be repeating itself, with subsequent performance currently tracking above the historical average. However, with March still prominent in the rearview mirror and with markets violently oscillating, what is the likelihood we will see a deviation from history’s script?
‘Once you notice a phenomenon, you believe it happens a whole lot’1
If the Baader-Meinhof phenomenon, or frequency illusion, is any guide then the immediacy of March’s reversal may result in the perception that reversals occur more frequently now than they have done in the past. Indeed, in the space of two years we have seen a global pandemic, war returning to Continental Europe and the worst bond sell-off since the Napoleonic era, so investors may be forgiven for letting out a Primal Scream, heading to The Winchester, having a nice cold pint and waiting for the next reversal to inevitably materialise (although granted, we are not facing a scenario quite as apocalyptical as in Shaun of the Dead ).
To dispel this perception, before it becomes embedded in our collective psyche, we can again look to history and posit the question; are we amid a reversal of fortune for trend-following strategies where reversals occur with greater frequency?
The broad scatter of plots shows that reversals are relatively evenly distributed over history, with no indication that these have become more frequent in recent times.
To answer this, in Figure 2 we plot the instances where the SG Trend Index loses more than five percent over the trailing five days against the corresponding 12-month trailing return of the index as at the peak before each reversal date. The plots are then sized in accordance with the magnitude of the five-day drawdowns, with the largest plot corresponding to a loss of greater than ten percent.
The conclusions that we can draw are twofold: firstly, the broad scatter of plots shows that reversals are relatively evenly distributed over history, with no indication that these have become more frequent in recent times (so much for Baader-Meinhof). Secondly, reversals tend to cluster around periods where trend-following performance has been positive, occurring here in over eighty-five percent of instances. This point is intuitive, and links back to our original observation that reversals, by definition, occur at the end of a trend.
Figure 2. Trend-following performance in 12 months preceding a reversal of more than 5% in five days. Size of point represents the magnitude of the reversal.
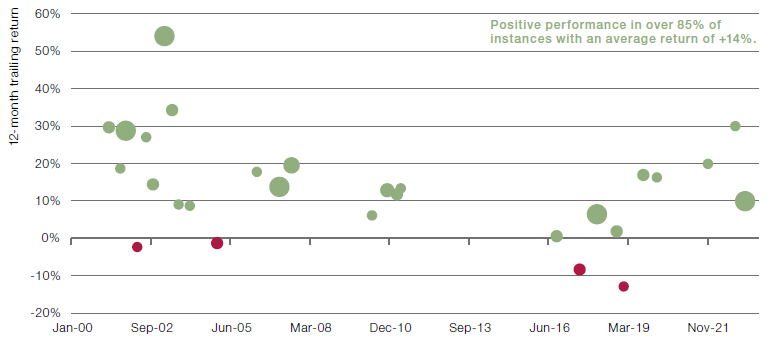
Date range: 1 January 2000 to 31 August 2023. Source: Man Group database and Société Générale.
In Figure 3, we analyse trend-following’s performance in the 12 months after a reversal. For this purpose, November 2022 and March 2023 have been excluded given that these reversals occurred less than 12 months ago. In keeping with our original results, we find that the average return across all instances is a gain of nearly ten percent, with positive performance in 65 percent of cases.
Figure 3. Trend-following performance in 12 months after a reversal of more than 5% in five days. Size of point represents magnitude of the reversal.
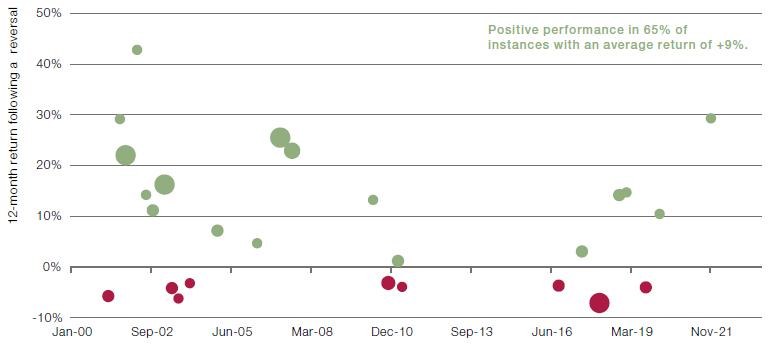
Date range: 1 January 2000 to 31 August 2023. Source: Man Group database and Société Générale.
Conclusion
The patterns we have outlined should hopefully instill confidence in trend-following. While it may seem that market reversals are occurring with greater frequency, we have shown that there is no indication that this is the case. Further, when reversals do occur, we find that trend-following strategies tend to recoup losses within six to 12 months. Whether we will see a deviation from history’s script in relation to March’s SVB induced reversal remains to be seen, but at the time of writing, performance is tracking above the historical average.
In other words, when faced with a reversal, we believe that investors should take comfort from history and Keep Calm and Carry on Trend-Following.
1. ‘Why are we so illuded?’, Arnold M. Zwicky, Stanford University, September 2006.
You are now leaving Man Group’s website
You are leaving Man Group’s website and entering a third-party website that is not controlled, maintained, or monitored by Man Group. Man Group is not responsible for the content or availability of the third-party website. By leaving Man Group’s website, you will be subject to the third-party website’s terms, policies and/or notices, including those related to privacy and security, as applicable.