Key takeaways:
- We are seeing a renaissance in quantitative (‘quant’) investing after the Quant Winter of the late 2010s
- Today, the standard deviation across quant-manager returns is at its highest point since the Global Financial Crisis (GFC) as a group of managers increasingly incorporate idiosyncratic approaches
- A blend of traditional and alternative approaches may help provide uncorrelated sources of alpha and provide diversification from discretionary investments
Introduction
The increasing ability of quants to tailor strategies for complex investor preferences leads us to believe that we’re in the early days of a quant renaissance.
The past three years have heralded something of a revival for traditional quantitative (‘quant’) investing after a rocky period from 2018 to 2020 (the ‘Quant Winter’). While all managers have benefited from the tailwinds of a generally favourable factor environment, some have differentiated themselves further by incorporating idiosyncratic approaches.
Driven by advances in data science and data sourcing, the opportunity set for innovation-focused quants has materially changed. This, coupled with the increasing ability of quants to tailor strategies for complex investor preferences, leads us to believe that we’re in the early days of a quant renaissance.
Which factor approach – traditional or alternative – has the potential to offer investors the best source of uncorrelated alpha and lower volatility? Below, we compare the characteristics of the two.
Traditional quantitative approaches and their roles in portfolios
Traditional quant factors are the foundation of quant investing, which was born out of the financial econometric academic tradition. For example, Momentum investing aims to capitalise on the acceleration in directional price movements, either upward or downward. Quality investing entails identifying companies with disciplined approaches to cash flow and capitalisation. Value investing involves selecting stocks which appear to be trading for less than fundamentals would suggest.
As Value is often considered the original quant factor, it is hardly a revelation that quant managers have a track record of outperforming in Value-oriented markets. Discretionary managers, on the other hand, have tended to outperform in Growth-led markets. This naturally occurring low-to-negative return correlation suggests there may be a diversification benefit from the combination of these two investing approaches in an allocation framework.
Figure 1: Average information ratio (IR) by market type (January 2010 – December 2023)
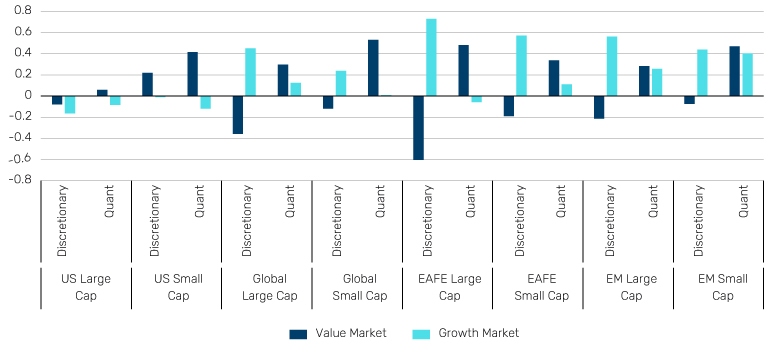
Source: eVestment, Man Numeric.
Figure 2: Excess return correlation: the median quant vs. the median discretionary manager (January 2010 – December 2023)
Source: eVestment, Man Numeric.
What’s changed?
The experience of this crisis has driven home the value of diversification and pushed some managers to innovate beyond the traditional factor lexicon.
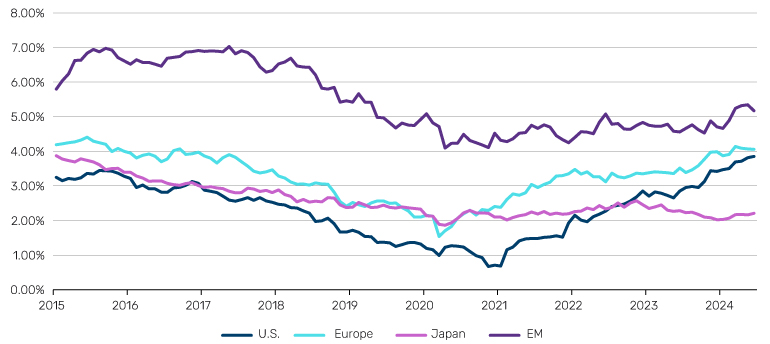
During the Quant Winter of 2018 to 2020, a shift in Federal Reserve monetary policy upset the performance of traditional factors. Against this backdrop, a market frenzy for Growth stocks led to a Value-factor drawdown. Finally, the ‘black swan’ event of the COVID-19 pandemic was exacerbated by fiscal stimulus and easy monetary policy. This, in turn, worsened quant investors’ plight, as it further concentrated market winners and culminated in a Momentum meltdown as well.
The experience of this crisis has driven home the value of diversification and pushed some managers to innovate beyond the traditional factor lexicon. In fact, today the standard deviation across quant-manager returns is at its highest point since the GFC.
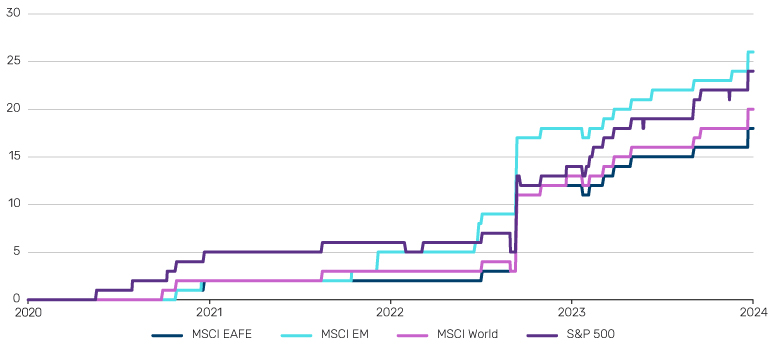
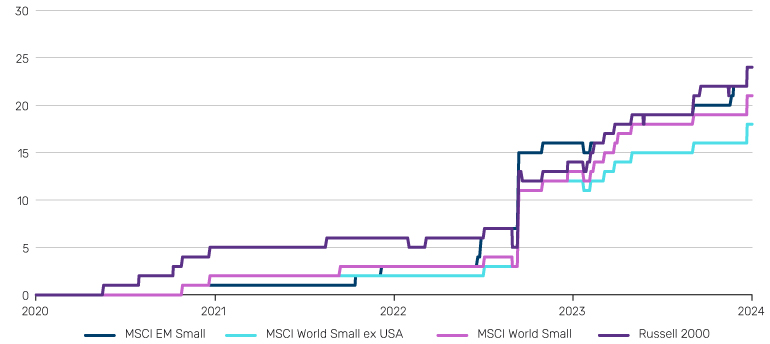
Figure 3: The cumulative average Barra factor performance across regions1
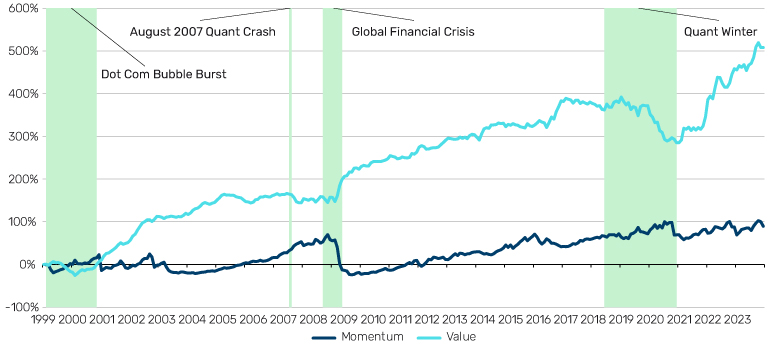
Source: Barra, Man Numeric. Data as at Dec 31 2023.
Figure 4: Rolling 3-year cross-sectional standard deviation of quant manager excess returns (the average across regions)
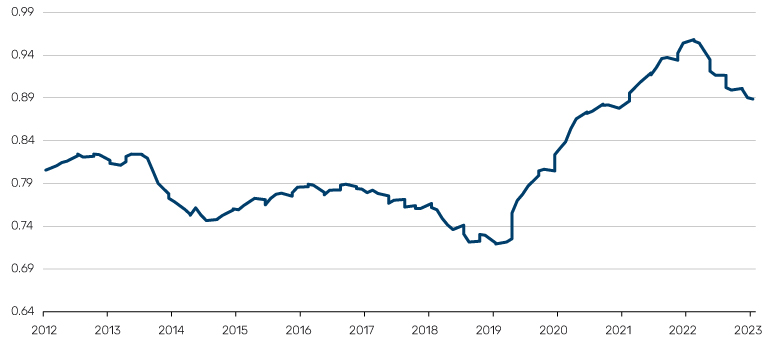
Source: Man Numeric, eVestment. Data as at Dec 31 2023.
The rise of idiosyncratic approaches and their role in portfolio construction today
The prolonged drawdown of traditional factors highlighted the need for alternatives and exponentially accelerated the research already underway.
The growth in these idiosyncratic approaches stems from two phenomena. The foundations of both were well in place before the recent downturn; but the prolonged drawdown of traditional factors highlighted the need for such alternatives and exponentially accelerated the research already underway.
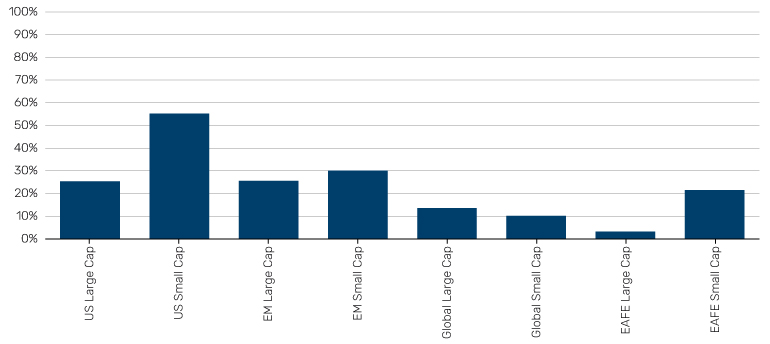
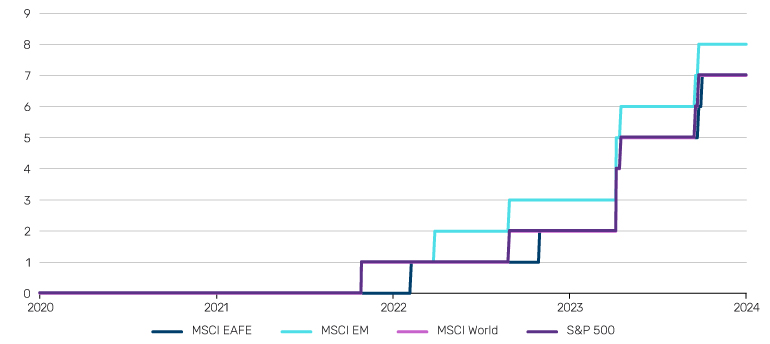
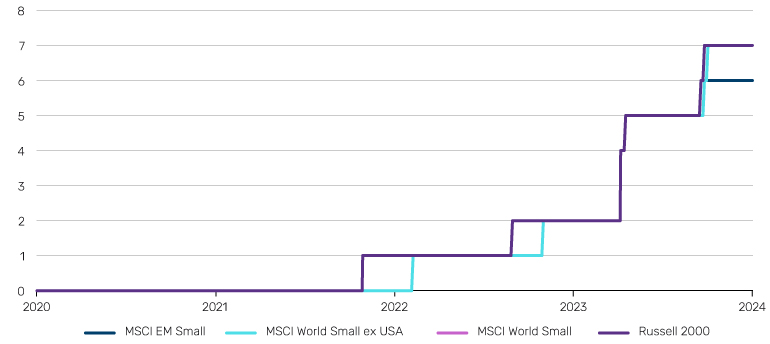
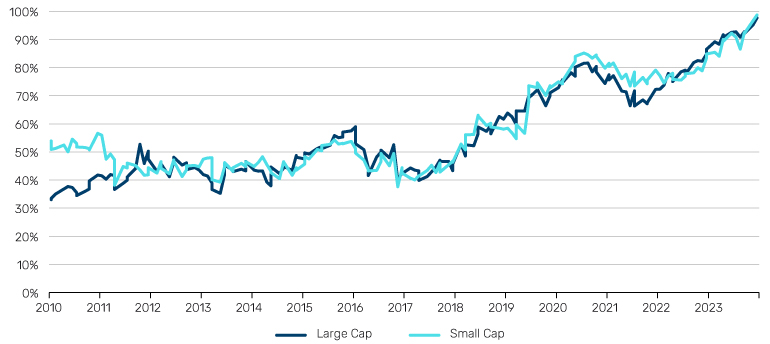
The first of these was the explosion of the alternative data sector. Novel datasets tracking metrics such as geolocation/foot traffic, patent filing counts, and credit card transaction spend allowed for the development of models based on sources entirely outside the realm of traditional financial data. Though there are differences in alternative data availability across markets, since 2019, Man Numeric has built up alternative data capabilities across regions and cap sizes – nearly tripling the count of models these past two years alone.
Figure 5: Change in number of Man Numeric alternative data models by universe, large cap
Source: Man Numeric. Data as at Dec 31 2023.
Figure 6: Change in number of Man Numeric alternative data models by universe, small cap
Source: Man Numeric. Data as at Dec 31 2023.
As these methodologies require substantial data depth and breadth for training, the alphas they produce tend to offer substantial breadth in their coverage.
Simultaneously, although machine learning (ML) techniques were developed over the past few decades, they found their way into quantitative investing as their applications to low signal-to-noise ratio market data began to be ironed out. Although these techniques can be implemented on traditional financial data sources, the more idiosyncratic signals they create are generally focused on non-linear relationships that are orthogonal to the outputs of classic financial econometrics. Furthermore, as these methodologies require substantial data depth and breadth for training, the alphas they produce tend to offer substantial breadth in their coverage.
Figure 7: Change in number of Man Numeric novel technique models by universe, large cap
Source: Man Numeric. Note: Only alpha models included. Count does not include use of novel techniques in risk or portfolio construction. Data as at Dec 31 2023.
Figure 8: Change in number of Man Numeric novel technique models by universe, small cap
Source: Man Numeric. Note: Only alpha models included. Count does not include use of novel techniques in risk or portfolio construction. Data as at Dec 31 2023.
Targeting uncorrelated alpha sources and lower volatility
The correlations of today’s alphas with those we had heading into the Quant Winter presently average around 40-50% across all regions.
The promulgation of various novel data sources and methodologies means that, for firms which have focused on identifying and expressing idiosyncratic alpha opportunities, the alpha sources of today can look quite different from those of the 2010s – and from the current alphas of competitors who have not expanded beyond traditional factor investing. Within Man Numeric, the correlations of today’s alphas with those we had heading into the Quant Winter presently average around 40-50% across all regions.
Figure 9: The average alpha correlation between backcast and ‘as was’ alphas
Source: Man Numeric. Data as at Dec 31 2023.
With the contributions of these models quant alpha payoffs have more than recovered from the drawdowns of the Quant Winter.
In the years since their introduction, these innovations have been a source of positive risk-adjusted alpha. When we look at the performance since introduction, we see that these new data and new technique models have substantially outperformed traditional quant factors.
Figure 10: Annualised IR - Barra vs. new data & new technique models (Jan 2020 – Dec 2023)2
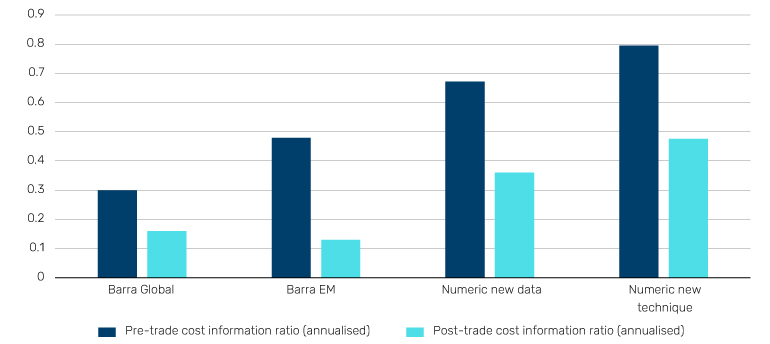
Source: Man Numeric, MSCI Barra
With the contributions of these models, quant alpha payoffs have more than recovered from the drawdowns of the Quant Winter and continue to strengthen relative to their traditional quant factor counterparts as demonstrated in Figure 11 – which measures the excess idiosyncratic return.
Figure 11: Annualised return - rolling 5-year incremental payoff over generic factors3
Source: Barra, Man Numeric
Conclusion: Adding orthogonal alpha
The years since the Quant Winter have seen a renaissance in quantitative investing. Unconventional data sources and novel financial applications for state-of-the-art algorithms have broadened the realm of possibilities for orthogonal alpha sources. These nascent models are already earning their keep in the new quant estate. With their help, and the overall strong history of traditional quant factors, even with the Quant Winter factored in, quantitative strategies may appear enticing over the long term. Their low correlation with discretionary managers, in turn, may potentially improve investment outcomes for strategies that allocate to both approaches.
eVestment data time periods provided were included based on most robust underlying manager data set available at time of writing.
1. Regions are defined as S&P 500, MSCI World, MSCI EAFE, MSCI EM, Russell 2000, MSCI World Small, MSCI World ex US Small, and MSCI EM Small. All spreads shown are long/short quintile model spreads where we take the average return of the top 20% ranked named and subtract the average return of the bottom 20% ranked named (rankings based on Barra scores) and display the difference. These spread returns are instantaneously rebalanced, sector-neutral, and do not reflect transactions costs.
2. Quintile daily backtest, 5-day alpha lag, restricted to the corresponding EM/GLO universes. Management fee assumption of 85 bps. Net-of-fees attribution and/or contribution figures have been included to meet regulatory requirements. The analysis is calculated on a gross basis with the difference between net and gross resulting from fees, expenses and other portfolio returns not captured by the underlying gross data. The net figures have been derived by apportioning this difference evenly for every portfolio security line item. Net-of-fee attribution and/or contribution is not representative of actual results, and should not be relied upon when making investment decisions.
3. Net-of-fees attribution and/or contribution figures have been included to meet regulatory requirements. The analysis is calculated on a gross basis with the difference between net and gross resulting from fees, expenses and other portfolio returns not captured by the underlying gross data. The net figures have been derived by apportioning this difference evenly for every portfolio security line item. Net-of-fee attribution and/or contribution is not representative of actual results, and should not be relied upon when making investment decisions.
You are now leaving Man Group’s website
You are leaving Man Group’s website and entering a third-party website that is not controlled, maintained, or monitored by Man Group. Man Group is not responsible for the content or availability of the third-party website. By leaving Man Group’s website, you will be subject to the third-party website’s terms, policies and/or notices, including those related to privacy and security, as applicable.