Introduction
As our clients and readers of our market commentary may be aware, we have been sceptical of the positive impact of the latest iteration of quantitative easing policy on risk asset prices generally, and emerging market (‘EM’) asset prices in particular. As we have previously argued, we believe EM largely suffers from fragile fundamentals, stretched valuations (for credit and rates in particular) and crowded positioning.
Our scepticism, however, has faced increased pushback. The main argument against our view is that major central banks are stuck in a framework where low and decreasing inflation could lock in a highly accommodative monetary stance for a long time to come, and where any weakness in risk assets would trigger even more aggressive easing, effectively limiting the downside. In this article, we review recent developments globally and in EM, provide an update on market positioning and discuss why we believe that the faith placed in global central banks’ puts may be misplaced.
Recorded on 24 July 2020
This Time Is Different
In March, when authorities in most developed countries implemented shutdowns across multiple sectors of their economies, policymakers and market participants believed that Covid-19 would trigger a sharp but short recession. They also believed that fiscal policy expansion would help the real economy replace lost income and monetary policy expansion would prevent market dislocations, allowing issuers to roll over their debt and economic activity to fully recover. This line of thinking underpinned the recovery in both credit and equities witnessed between early April and June.
Although we believed in late March that we would see a strong policy response to stabilise markets, we disagreed with the market optimism and suggested looking beyond the contraction in 2020 to the longer-lasting consequences of this pandemic on the global economy. Indeed, we believe that mounting evidence will soon show that expectations on a V-shaped recovery may be misplaced.
If our suspicion proves right, central banks and fiscal authorities may be forced to reconsider their generous stimulus plans. Indeed, if the pandemic leaves traces of more structural damage to the global economy, as we suspect it will, we may see fiscal/monetary headwinds going forward, as the fiscal expansion initially designed to replace the loss of temporary output faces the reality of a more structural economic damage.
Fiscal and monetary stimulus help only to the extent that aggregate demand is below its potential. This is still probably the case. As soon as demand partially recovers, if global output potential gets impaired, we believe indiscriminate policy support will prove counterproductive, even if it can be afforded. Both internal budget and monetary policy discussions in the US, and most of the G7, carry this logic. For these reasons, and given the pace at which evidence of structural economic damage is building up, we suspect that the horizon for generous policy support may be shorter than the market may think.
Our views have been challenged with the idea that risk assets should never fight the Federal Reserve. Indeed, former episodes of quantitative easing and Fed balance sheet expansions have proven a great environment for risk assets. This time, however, we do not see it that way. Once monetary policy has reached its limits, the only role for the Fed is to keep the curve broadly stable as fiscal stimulus kicks in. That implies that the balance sheet will endogenously expand as the fiscal stimulus widens. We agree that keeping the yield curve from widening is beneficial. However, to avoid the fiscal stimulus from crowding (in private spending in consumption and investment) and thus reaping the full benefits of fiscal stimulus, we believe this balance-sheet expansion is not proactive monetary policy this time around. It is for this reason that the recent leg of central bank bond purchases should not be considered as supportive for risk sentiment as in the past.
This logic suggests that if fiscal stimulus were to be tapered on the perception that potential output has been impaired, the balance sheet expansion will have to slow too. Those placing their confidence in the Fed plugging the stimulus gap and providing a put to risk assets may find it greatly misplaced.
In addition to the economic logic, we also see mounting socio-political limits that may limit support for risk assets. These are discussed towards the end of this article.
This backdrop makes the outlook for EM countries particularly challenging for the coming months. In our view, it all boils down to the shape of the recovery.
The Economic Recovery Is Unlikely to Be V-Shaped
Given the recent rise in the number of new cases of Covid-19 across multiple states in the US, we believe it is becoming increasingly difficult for the US economy to return to the levels of activity experienced before February 2020. In our view, there are two indicators proving that this economic deceleration will be protracted: the evolution of weekly jobless claims in the 40 years to 2019 (Figure 1) and the evolution of weekly jobless claims during 2020 (Figure 2). Indeed, if US employers had expected the economy to normalise in the near term, initial jobless claims would have already returned to the 200,000-600,000 range typically observed in the last few decades, in our view.
After the initial rounds of layoffs in April and early May on the back of the shutdown, we continued to see high numbers of initial claims from mid-May. We believe these are related to layoffs that are likely to be more structural and longer lasting, substantially reducing the likelihood of a V-shaped recovery.
Figure 1. Weekly US Jobless Claims (1979-2019)
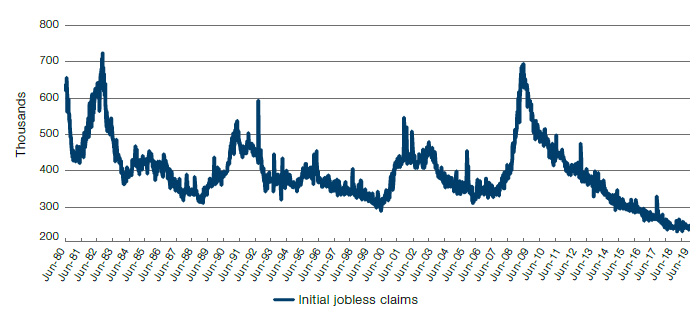
Source: Bloomberg; as of end-2019.
Figure 2. Weekly US Jobless Claims During 2020
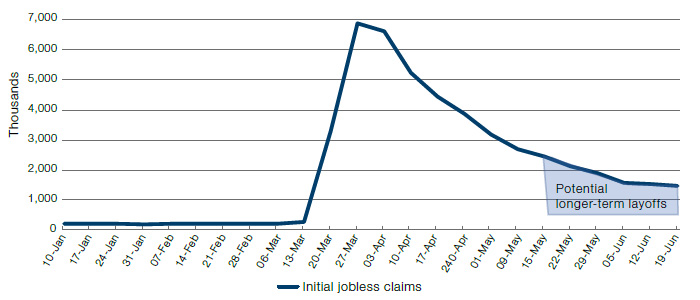
Source: Bloomberg; as of 19 June 2020.
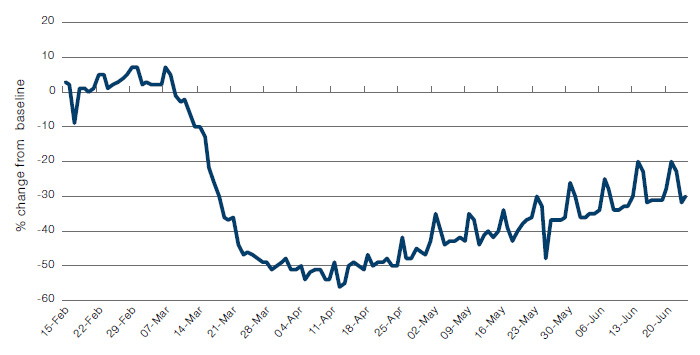
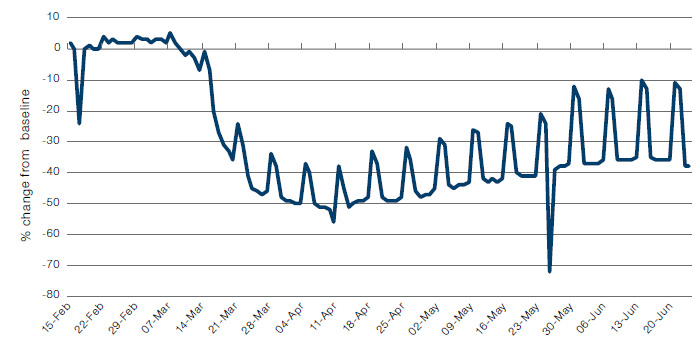
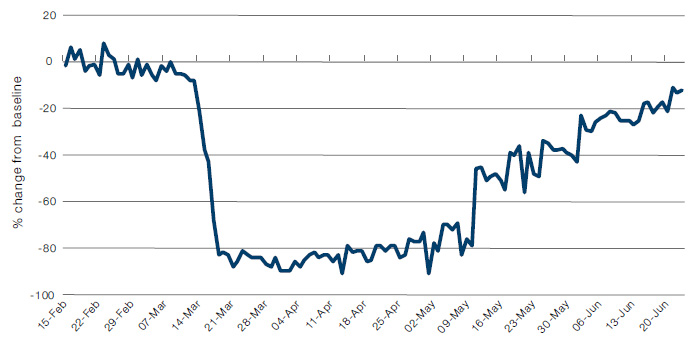
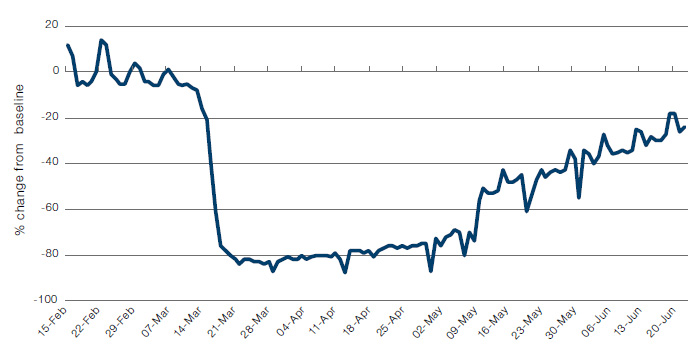
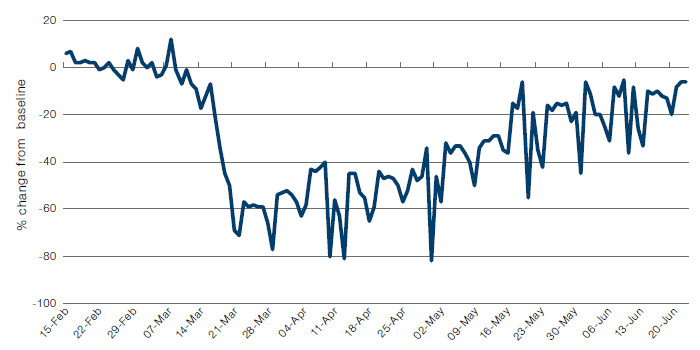
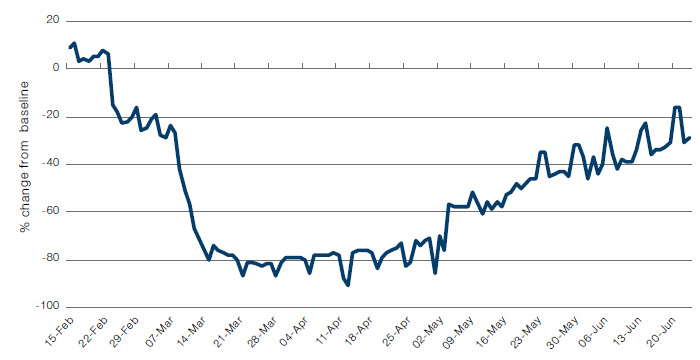
This dynamic seems to be confirmed by Google’s Community Mobility Reports1, which show how visitors to (or time spent in) different places have changed, compared with a baseline median value for that day of the week during the 5-week period between 3 January and 6 February, 2020 – i.e. before the pandemic extended outside of China.
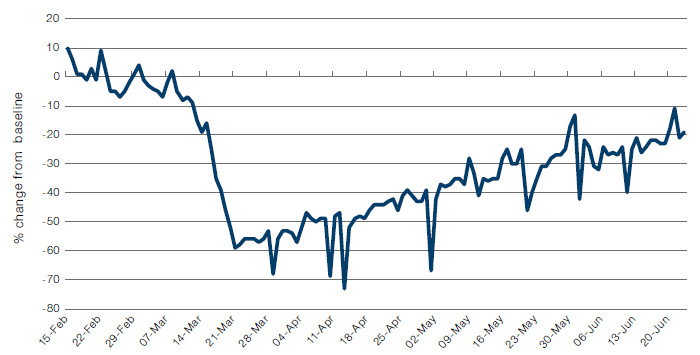
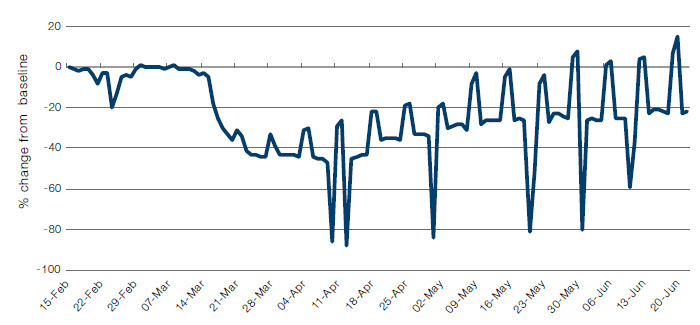
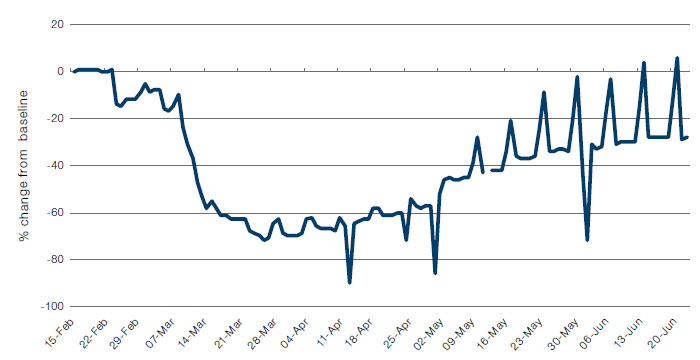
Figure 3 shows that activity in the retail and recreation sector is languishing 10-20% below the baseline. This figure seems to have been plateauing in the second and third weeks of June. Public transport (Figure 4) and time spent at the workplace (Figure 5) are still 20-30% and 10-40%, respectively, below baseline levels. Indeed, time spent at workplaces have actually begun to decline again in the last few days.
Figure 3. Retail and Recreation Mobility, US
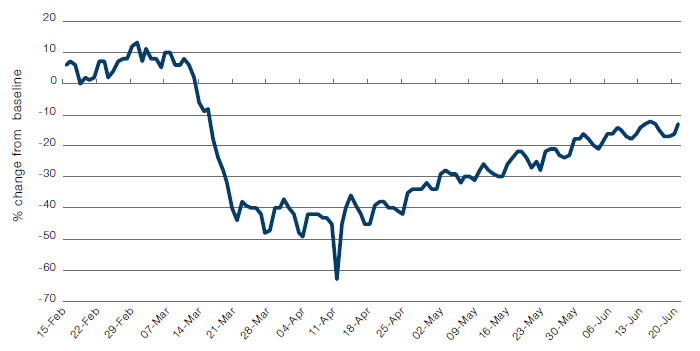
Source: Google; as of 30 June 2020.
Figure 4. Public Transport Mobility, US
Source: Google; as of 30 June 2020.
Figure 5. Workplace Mobility, US
Source: Google; as of 30 June 2020.
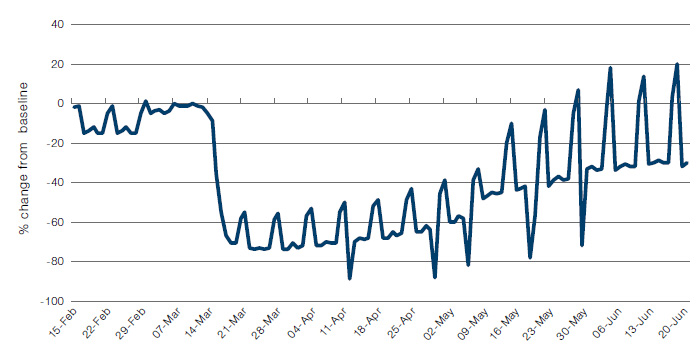
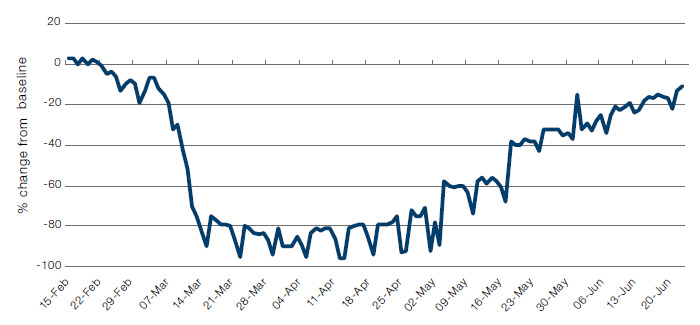
The European recovery seems to have been more pronounced than in the US, at least in the larger economies. However, this still falls short of a return to normality, with a plateauing of the time spent at workplaces, without which it is difficult to believe that a complete normalisation or V-shaped recovery is possible.
Figure 6. Retail and Recreation Activity, France
Source: Google; as of 30 June 2020.
Figure 7. Public Transport Mobility, France
Source: Google; as of 30 June 2020.
Figure 8. Time Spent at Workplaces, France
Source: Google; as of 30 June 2020.
Figure 9. Retail and Recreation Activity, Germany
Source: Google; as of 30 June 2020.
Figure 10. Public Transport Mobility, Germany
Source: Google; as of 30 June 2020.
Figure 11. Time Spent at Workplaces, Germany
Source: Google; as of 30 June 2020.
Figure 12. Retail and Recreation Activity, Italy
Source: Google; as of 30 June 2020.
Figure 13. Public Transport Mobility, Italy
Source: Google; as of 30 June 2020.
Figure 14. Time Spent at Workplaces, Italy
Source: Google; as of 30 June 2020.
Meanwhile in China, where the pandemic began and was thus controlled earlier than has been the case for both Europe and the US, the government can directly or indirectly influence activity in certain sectors through the expansion of credit or fiscal policy (e.g. construction, property sales, IP). Despite the intervention, China was still far from making a full recovery by the end of May. Moreover, the pace of the use of transportation is still substantially below pre-pandemic levels (Figures 15-17).
Figure 15. China Activity Index
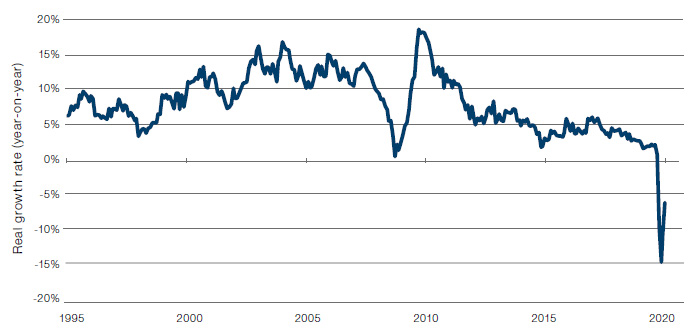
Source: Emerging Advisors Group; as of 22 June 2020.
Figure 16. Chinese Growth by Component
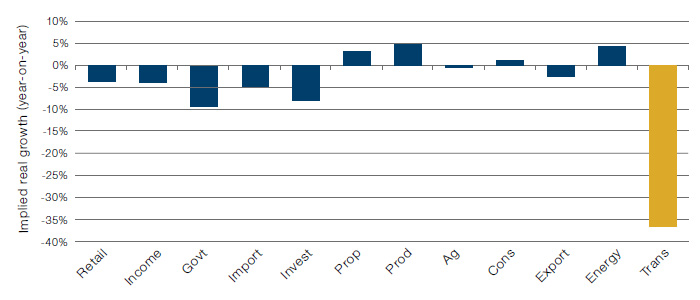
Source: Emerging Advisors Group; as of 22 June 2020.
Figure 17. Chinese Transport Turnover
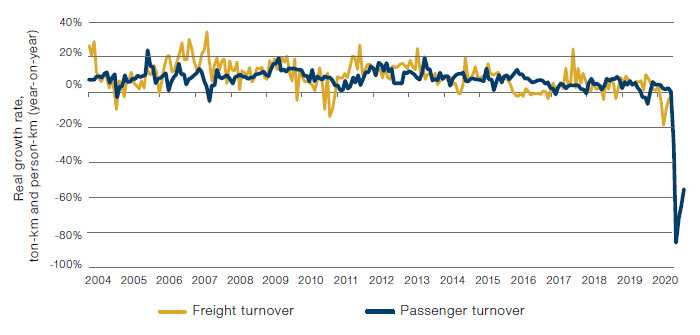
Source: Emerging Advisors Group; as of 22 June 2020.
So, based on the developments described above for the US, Europe and China, it seems unlikely that any of those large economies are going to experience an acceleration in growth that will substantially increase the marginal demand for EM products. As such, we believe EM countries will be on their own over the coming months, constrained by weak demand and pricing power for their export products, as well as dealing with the evolution of the pandemic within their own borders. Indeed, as of 15 June, daily new cases in EM countries had doubled in just one month and were still growing exponentially (Figure 18).
Figure 18. EM New Cases by Region
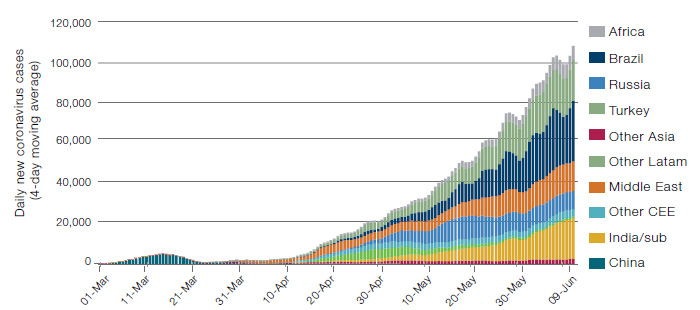
Source: Emerging Advisors Group; as of 15 June 2020.
It’s worth pointing out that there are roughly three billion people living in the EM world excluding China. If infection dynamics are not brought under control, these countries will be bogged down in a process of shutdowns and restarts that will not just hurt their economies, but will also prevent the normalisation of global travel. Against this backdrop, EM managers are now running staggering levels of risk, in our view.
Doubling Down During the Dip
Figure 19 shows the returns for the main EM benchmarks during selected periods during 2020, the returns for the largest 19 EM Total Return funds and the average return for such funds during each period. The bottom row (implied beta) estimates what the average return for all of the funds was for every one percentage point of return in the blend of the hard and local currency benchmarks during the period.
Total return funds tend to be marketed as benchmark-aware or agnostic, capable of cutting risk to avoid severe drawdowns. As Figure 19 shows, in late February, managers were running healthy levels of risk (with an average beta of 0.81). This increased during the selloff in March as the segments of the market that they were overweight (frontier countries and high yield corporate credit) got stressed and experienced outflows, further increasing the overweights. Not satisfied with this, in the latter part of the recovery rally in June, they increased their risk to a beta of 1.48, which is among the highest (if not the highest) that we have ever seen in this space.
Figure 19. Performances of Largest EM Total Return Funds
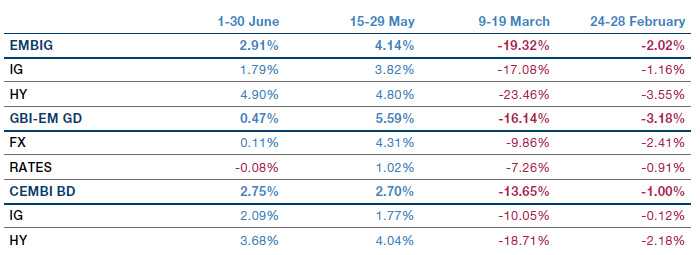
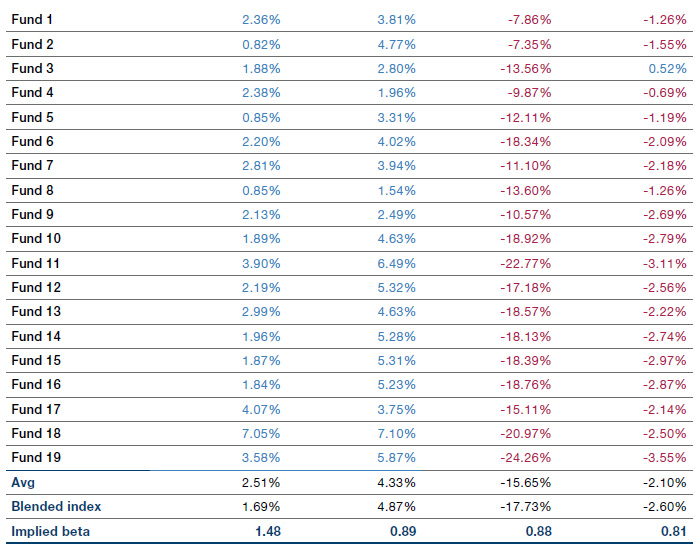
Source: Bloomberg; as of 30 Jun, 2020.
Man GLG has selected the largest 19 daily priced Emerging Markets Debt Total Return funds as identified by the eVestment database Emerging Markets Fixed Income – Blended Currency universe. Only constituents with USD1 billion or more in the strategy have been included. This data being represented is not the complete universe of this asset class and investment decisions should not be made based upon this data. Mutual funds may be subject to additional fees and restrictions, therefore this data may not be representative of Man GLG’s products. The indices shown are the JP Morgan Emerging Market Bond Index Global, Government Bond Index-Emerging Markets Global Diversified, and Emerging Market Corporate Bond Broad Diversified Index. The Blend is comprised of 50% JPM EMBIG and 50% GBI EM Global Div Indices.
We have discussed in two previous notes (which can be found here and here ), how EM countries entered the pandemic with a debt overhang, which has subsequently become worse because of the pandemic. As we have shown, there is no fundamental reason to expect an improvement in the near or medium term. Additionally, from a positioning perspective, we believe the market is set up for a bigger drop than the one that we saw in March. In our view, prices can be justified only in the event that one or both of the following two things take place:
- A vaccine or medical treatment that can be rapidly deployed globally;
- Central banks continue to print money and buy assets for as long as inflation does not pick up (or it picks up because market participants expect central banks to stay deliberately behind the curve).
Nevertheless, it is becoming increasingly evident that the road to global immunisation may be longer than the market may think. Mass immunisations could only start by the summer of 2021 in the developed world, likely leaving EM expose to infection bouts beyond 2022. Such a long road could possibly create high default rates in the segments of the US high yield market not supported by Fed purchases, and leave EM sovereign assets exposed to substantial downside risks, either through inflation or default.
We also regard the ability of central banks to keep buying assets as limited. We believe that EM central banks can help address temporary liquidity problems due to market dislocations, but they cannot convince market participants to hold on to potentially insolvent bonds regardless of how much temporary support they are willing to provide, especially if bond prices did not reflect the likely losses.
Conclusion: Caution Ahead
Recent developments make it increasingly unlikely that we will see a V-shaped global recovery as initially expected by policymakers and most market participants. The EM world faces a debt overhang problem and is exposed to overextended market positioning. We suspect that we are entering a phase in this pandemic-led cycle, where central banks and fiscal authorities realise that global potential output may have been impaired for some time. Under this view, authorities would have to come to terms with the idea that liquidity problems have turned into solvency issues, constraining fiscal and monetary authorities from providing the put currently priced by risk assets, at precisely the moment when positioning in EM is wrongly footed. We hope to learn a lot about the shape of this recovery over the course of this summer. In the meantime, the risks from a disappointing recovery keep us cautious during these exuberant markets.
1. These reports are created with aggregated, anonymised sets of data from users who have turned on the Location History setting, which is off by default.
You are now leaving Man Group’s website
You are leaving Man Group’s website and entering a third-party website that is not controlled, maintained, or monitored by Man Group. Man Group is not responsible for the content or availability of the third-party website. By leaving Man Group’s website, you will be subject to the third-party website’s terms, policies and/or notices, including those related to privacy and security, as applicable.