Introduction
What impact will Covid-19 have on emerging-market debt as the virus continues its world tour?
In a nutshell, we will remain negative on emerging-market (‘EM’) assets until we see evidence that the risks of a pandemic infection has subsided. We believe that most countries – both in developed, but particularly in emerging markets – do not have the ability to deal with a viral infection spread like China, which essentially enforced self-quarantine over millions of people, locked down major cities and provided expedited health care to thousands of infected citizens to curb the rate of contagion.
As a result, we believe we could experience a steep correction in both the local and external EM indexes driven by EM FX, credit and local rates.
What Could Drive the Correction?
We believe we could see a steep correction in both the local and external EM indexes for several reasons.
First, real-time activity indicators in days after the Chinese New Year already pose a worrisome outlook for EM debt: relative to the same period in 2019 (counting from the Chinese New Year onwards), coal consumption in China has fallen by 27%, 30-city property sales by 69%, the 100-city average transport and congestion index by 19% and passenger volume by railway by 75% (Figures 1-4).
Figure 1. Daily Coal Consumption of 6 IPPs
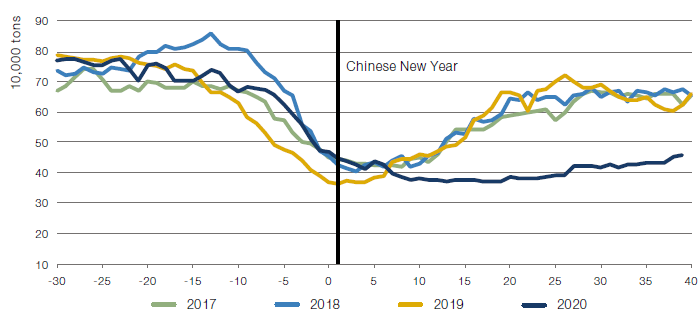
Figure 2. 30 Major Cities' Daily Property Sales
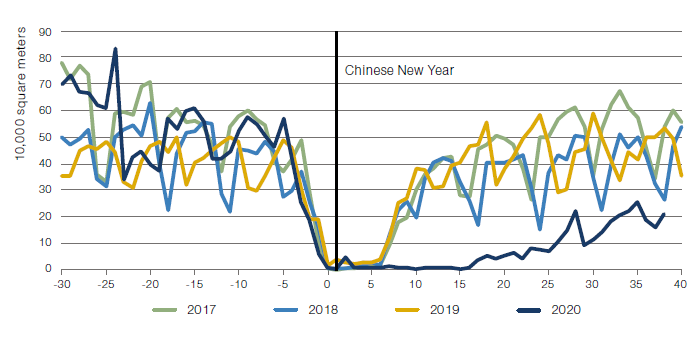
Figure 3. Transport Congestion Index
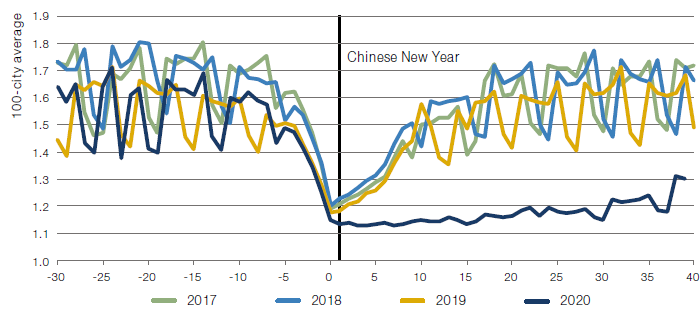
Figure 4. Passenger Volume
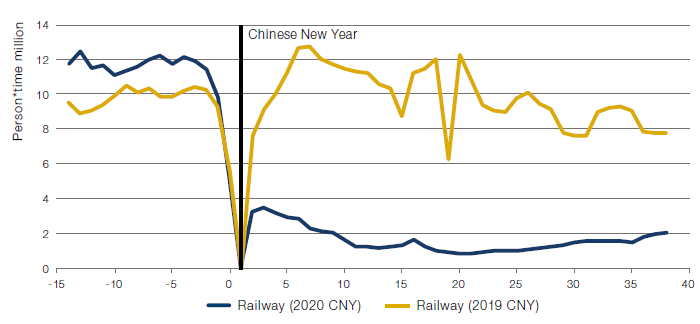
Source: UBS; as of 4 March 2020.
Secondly, the Chinese authorities have got a better handle of the situation than the US Federal government, in our view. The latter’s reaction has been driven by the US administration’s aim to keep activity strong and equity markets supported ahead of the upcoming presidential election and its effort to deal with the crisis has been disorganised. Furthermore, we also see a complacency over this crisis around the EM world, where the severity could be heightened by the lack of resources to deal with a major outbreak. We are concerned about the potential impact on global activity if the testing and preventive measures come too late.
Third, even ignoring the risk of contagion, we see limited fiscal headroom in many EM countries – such as Indonesia, South Africa, Turkey, Brazil and Colombia – to deal with a Chinese slowdown. The supply chain, which had already been hit pre virus by trade and geopolitical concerns, has become significantly more strained after the virus outbreak.
Fourth and contrary to market consensus, we continue to believe that the US dollar is not expensive. The market view that the US dollar is expensive is largely predicated on the Federal Reserve’s trade-weighted US dollar versus USDCNY (inverted), which shows how the US dollar appreciated during the 2010s (depicted by the blue line on Figure 5). The main reason for this move was the depreciation of the Chinese yuan versus the US dollar, which coincided with China becoming an important trading partner to the US.
Figure 5. Fed’s Trade-Weighted US Dollar Versus USDCNY (Inverted)
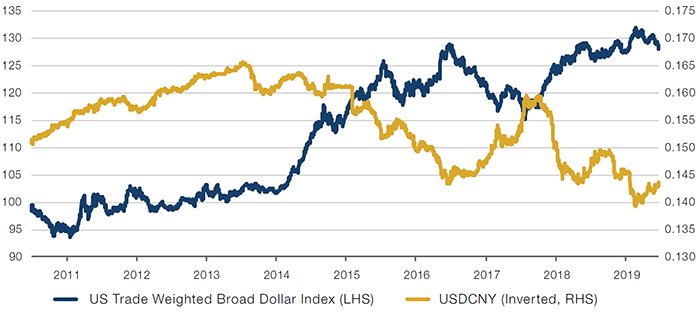
Source: Bloomberg; as of 4 March 2020.
Nevertheless, if the valuation of the US dollar is compared with other currencies that have been freely floating for the last three decades, it appears that ex-China, the US dollar is roughly in the middle of the range observed in the last 30 years (Figure 6).
Figure 6. Fed’s USD Trade-Weighted Against Major Currencies
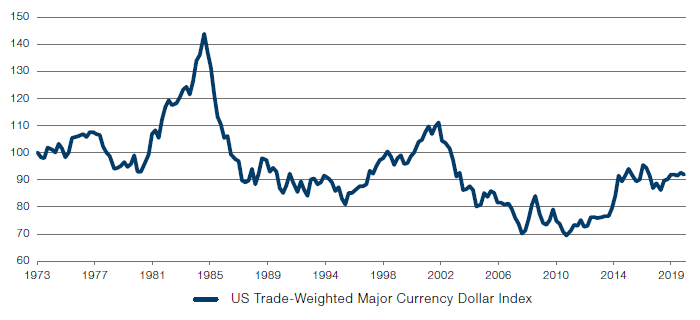
Source: Bloomberg; As of 4 March 2020
So, the ‘expensive’ dollar view, expressed by the majority of market participants, is valid to the extent that one believes that Chinese yuan is very cheap versus the US dollar and thus has substantial potential for appreciation. Otherwise, the valuation of the US dollar shown in Figure 5 is just skewed by the yuan. However, over the last 15 years, the US current account balance/GDP has improved, while China’s has deteriorated. This has forced the Chinese government to tighten its capital controls to prevent outflows, which suggests limited appreciation potential of the yuan versus the US dollar, in our view.
The fifth reason is market positioning seems extremely stretched. Oversubscribed repo auctions and substantial repo funding has gone to finance large US Treasury cash positions, where hedge funds (and some additional market participants) arbitrage cash treasuries with futures (20-30 times levered). We see similar arbitrage activity across EM curves as they have been a low-vol (high-Sharpe ratio) source of return. Finally, quantitatively driven equity portfolios have been running several turns of leverage (albeit with neutral beta to benchmarks) to attempt to extract alpha, and momentum investors got caught close to limit long risk. This accumulation of leverage – in an environment where volatility has substantially increased – could easily trigger the unwind of the levered positions against a dealer community with no ability or appetite to provide liquidity.
Last but not least, we believe rate cuts by central banks will have limited impact on the supply disruption caused by this epidemic. At best, the rate cuts may be able to slow down the contraction in demand generated by the equity selloff, while hoping that supply comes back on line. Indeed, we rule out any meaningful proactive stimulus by the Bank of Japan or European Central Bank given they have run out of easing space.
Conclusion
In our opinion, EM countries have no room to maneuver in this environment and positions in EM assets have not been reduced in size. It took just one day worth of outflows (on 28 February) to drive EM rates to behave as risk and to create a disorderly widening in spreads. The anticipation of the Fed’s surprise cut halted what could have been the beginning of serious selling pressure. However, we are skeptical that market participants will be able to continue to hold on to their risk given the points made above.
You are now leaving Man Group’s website
You are leaving Man Group’s website and entering a third-party website that is not controlled, maintained, or monitored by Man Group. Man Group is not responsible for the content or availability of the third-party website. By leaving Man Group’s website, you will be subject to the third-party website’s terms, policies and/or notices, including those related to privacy and security, as applicable.