ARTICLE | 5 MIN | THE ROAD AHEAD

Was 16 June the S&P Trough? Probably Not

August 18, 2022

There is not a lot of upside for the S&P 500 from here, even under bullish multiple assumptions.

The date is 13 November 1929. The stock market has fallen 45% in less than two months. Are you at the bottom? You’re not sure. You wait. Two months go by and the market has rallied 25%. You’re frustrated. You’re missing out. You add risk. Another couple of months go by and stocks rally a further 17%. You’re vindicated. You add more risk. But ‘as flies to wanton boys are we to the gods; They kill us for their sport’. Your portfolio is down 83% over the next two years.

Was 16 June, market down 24%, the nadir, or a false trough?

You pick the wrong trough and you can end up dead in that ditch. While It feels unlikely that we are in an environment as extreme as the Great Depression, investors thinking about the road ahead from here are faced with a similar conundrum. Was 16 June, market down 24%, the nadir, or a false trough?

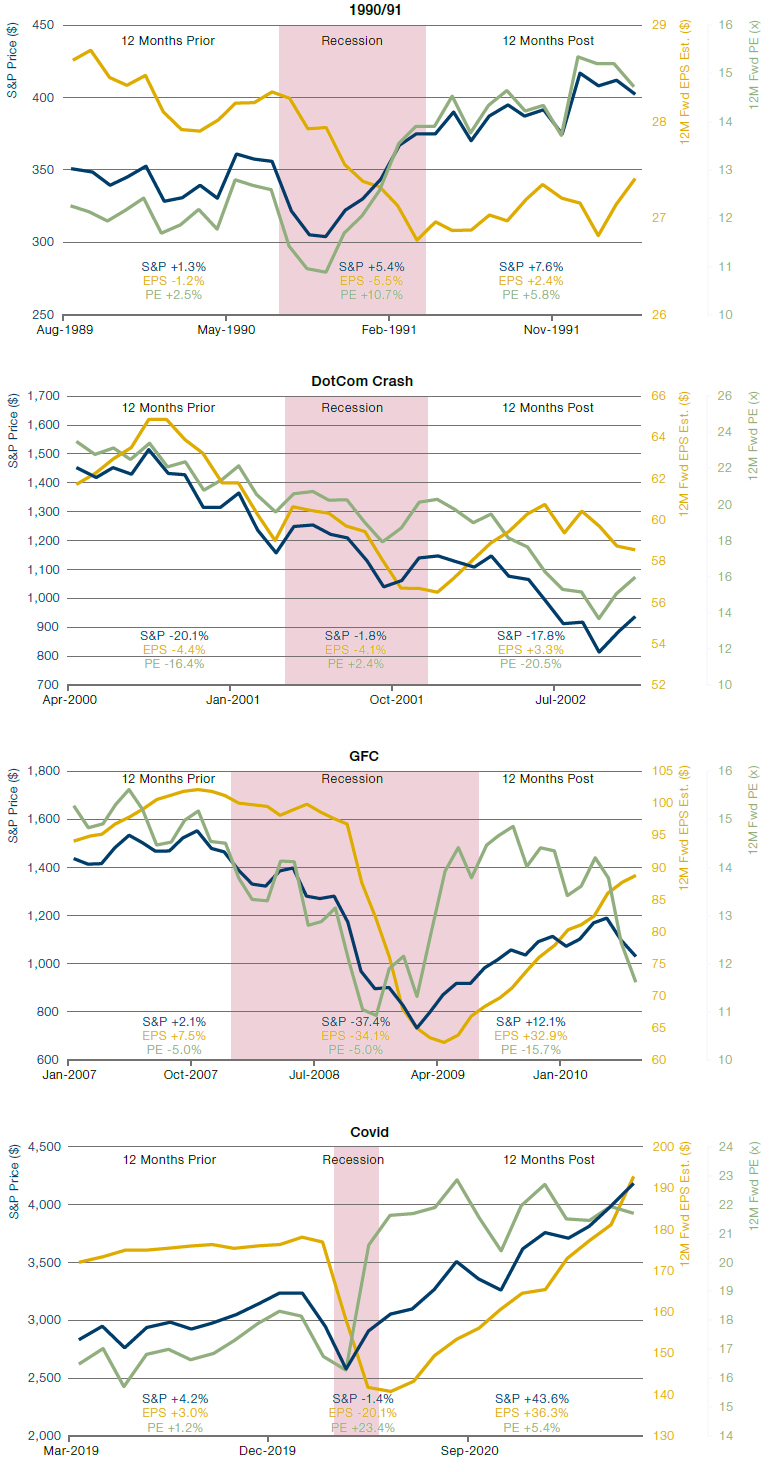
Looking at how forward earnings and the multiple travelled through prior periods of stress can give some hints toward an answer. As a shorthand we take historic US NBER recessions; Figure 1 charts these elements through the last four. For each we show the recession (red shaded area), and the 12 months either side. Blue on the blue vertical axis is the S&P price, yellow on the yellow vertical axis is forward EPS, and green on the green vertical axis is the multiple. We also show the percent move in each of these metrics in the 12 months prior to the downturn, in the recession itself, and in the 12 subsequent months.

Figure 1. S&P 500 Price, Forward Earnings and the Multiple Around and Through the Last Four Recessions
Source: Bloomberg, Man Solutions calculations. The periods selected are exceptional and the results do not reflect typical performance. The start and end dates of such events are subjective and different sources may suggest different date ranges, leading to different performance figures.

Eight observations:

We can call DotCom a valuation story, while GFC and Covid were more fundamentally orientated sell-offs.

  1. The peak to trough earnings revision, in chronological order, is -7%, -13%, -39%, -21%. On average -20%
  2. Similarly, the peak to trough multiple compression is 2, 10, 5 and 2 points. On average 5 points
  3. The trough multiple is 11x, 14x, 11x and 16x. On average 13x
  4. So broadly speaking, we can call DotCom a valuation story, while GFC and Covid were more fundamentally orientated sell-offs

5. If 16 June was the trough of the 2022 bear market, this one is a valuation tale as well. Peak to trough multiple compression through to the June low was 6 points (22x to 16x), while the downward earnings revision has, so far, been negligible

6. The multiple tends to trough prior to the earnings estimate, and on average four months before (admittedly in DotCom there was further compression following the recession trough)

7. In the prior four recessions, the multiple bounces markedly from its trough. In the six months following the nadir, in chronological order, it rises by 3, 2, 4 and 5 points. On average 3 points

8. IF EPS estimates follow their historical link with the ISM (see The Road Ahead: Here Come the Downgrades), this augurs for an integer of $190 in June 2023. That would represent a 21% peak to trough decline, in line with the Covid recession

And here’s a little thought experiment…

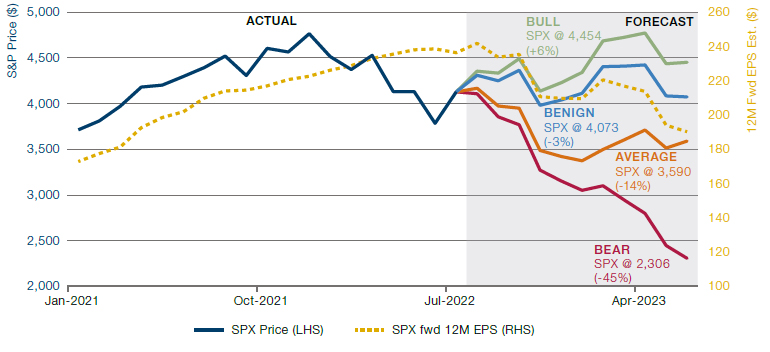
If earnings were to follow the pathway outlined in point (8), above, what would have to happen to the multiple to get a bull case. In Figure 2 (right hand panel) we show the projected EPS pathway (yellow dashed line, second vertical axis) and four forecasts for the S&P based on different multiple scenarios (outline in the left hand panel).

Figure 2. Some pathways for the S&P based on different multiple assumptions
Source: Bloomberg, Man Solutions calculations; as of August 2022.

Bull Case:

  • Inflation moderates faster than expected
  • Central bank pivot
  • Return of secular stagnation
  • Ukraine situation calms
  • Multiple returns to cycle high 23x (last seen 20 August)

Benign:

  • Inflation moderates enough
  • Central bank pivot
  • Ukraine situation stabilises
  • Multiple returns to end 2021 level of 21x

Average Of Previous Recessions:

  • Recession concern persists
  • Playbook of prior recessions plays out:
    • On average the multiple troughs 4 months prior to the forward earnings trough. Therefore assume trough multiple this time around is February 2023
    • Historic average multiple compression of 5 points. To June trough we were at -6 points. Therefore assume we revert back to June level (16x) by February 2023
    • On average the multiple rises 3 points in the 6 months following the trough. Therefore assume from February to June 2023 it rises from 16x to 19x

    Bear Case:

    • Inflation is stubborn
    • Recession is fully priced in
    • Multiple follows worst case scenario DotCom bust compression of 10 points
    • Multiple therefore drops to 12x

So – while there is a thicket of ifs, buts and nauseously worded compliance disclaimers around this – it would suggest that should earnings follow historical precedent, there is not a lot of equity upside from here, even under bullish multiple assumptions. This has been no ordinary cycle so it may well be that historical precedents are for the birds. But worth pondering.

For further clarification on the terms which appear here, please visit our Glossary page.

This information is communicated and/or distributed by the relevant Man entity identified below (collectively the "Company") subject to the following conditions and restriction in their respective jurisdictions.

Opinions expressed are those of the author and may not be shared by all personnel of Man Group plc (‘Man’). These opinions are subject to change without notice, are for information purposes only and do not constitute an offer or invitation to make an investment in any financial instrument or in any product to which the Company and/or its affiliates provides investment advisory or any other financial services. Any organisations, financial instrument or products described in this material are mentioned for reference purposes only which should not be considered a recommendation for their purchase or sale. Neither the Company nor the authors shall be liable to any person for any action taken on the basis of the information provided. Some statements contained in this material concerning goals, strategies, outlook or other non-historical matters may be forward-looking statements and are based on current indicators and expectations. These forward-looking statements speak only as of the date on which they are made, and the Company undertakes no obligation to update or revise any forward-looking statements. These forward-looking statements are subject to risks and uncertainties that may cause actual results to differ materially from those contained in the statements. The Company and/or its affiliates may or may not have a position in any financial instrument mentioned and may or may not be actively trading in any such securities. Unless stated otherwise all information is provided by the Company. Past performance is not indicative of future results.

Unless stated otherwise this information is communicated by the relevant entity listed below.

Australia: To the extent this material is distributed in Australia it is communicated by Man Investments Australia Limited ABN 47 002 747 480 AFSL 240581, which is regulated by the Australian Securities & Investments Commission ('ASIC'). This information has been prepared without taking into account anyone’s objectives, financial situation or needs.

Austria/Germany/Liechtenstein: To the extent this material is distributed in Austria, Germany and/or Liechtenstein it is communicated by Man (Europe) AG, which is authorised and regulated by the Liechtenstein Financial Market Authority (FMA). Man (Europe) AG is registered in the Principality of Liechtenstein no. FL-0002.420.371-2. Man (Europe) AG is an associated participant in the investor compensation scheme, which is operated by the Deposit Guarantee and Investor Compensation Foundation PCC (FL-0002.039.614-1) and corresponds with EU law. Further information is available on the Foundation's website under www.eas-liechtenstein.li.

European Economic Area: Unless indicated otherwise this material is communicated in the European Economic Area by Man Asset Management (Ireland) Limited (‘MAMIL’) which is registered in Ireland under company number 250493 and has its registered office at 70 Sir John Rogerson's Quay, Grand Canal Dock, Dublin 2, Ireland. MAMIL is authorised and regulated by the Central Bank of Ireland under number C22513.

Hong Kong SAR: To the extent this material is distributed in Hong Kong SAR, this material is communicated by Man Investments (Hong Kong) Limited and has not been reviewed by the Securities and Futures Commission in Hong Kong.

Japan: To the extent this material is distributed in Japan it is communicated by Man Group Japan Limited, Financial Instruments Business Operator, Director of Kanto Local Finance Bureau (Financial instruments firms) No. 624 for the purpose of providing information on investment strategies, investment services, etc. provided by Man Group, and is not a disclosure document based on laws and regulations. This material can only be communicated only to professional investors (i.e. specific investors or institutional investors as defined under Financial Instruments Exchange Law) who may have sufficient knowledge and experience of related risks.

Switzerland: To the extent this material is made available in Switzerland the communicating entity is:

  • For Clients (as such term is defined in the Swiss Financial Services Act): Man Investments (CH) AG, Huobstrasse 3, 8808 Pfäffikon SZ, Switzerland. Man Investment (CH) AG is regulated by the Swiss Financial Market Supervisory Authority (‘FINMA’); and
  • For Financial Service Providers (as defined in Art. 3 d. of FINSA, which are not Clients): Man Investments AG, Huobstrasse 3, 8808 Pfäffikon SZ, Switzerland, which is regulated by FINMA.

United Kingdom: Unless indicated otherwise this material is communicated in the United Kingdom by Man Solutions Limited ('MSL') which is a private limited company registered in England and Wales under number 3385362. MSL is authorised and regulated by the UK Financial Conduct Authority (the 'FCA') under number 185637 and has its registered office at Riverbank House, 2 Swan Lane, London, EC4R 3AD, United Kingdom.

United States: To the extent this material is distributed in the United States, it is communicated and distributed by Man Investments, Inc. (‘Man Investments’). Man Investments is registered as a broker-dealer with the SEC and is a member of the Financial Industry Regulatory Authority (‘FINRA’). Man Investments is also a member of the Securities Investor Protection Corporation (‘SIPC’). Man Investments is a wholly owned subsidiary of Man Group plc. The registration and memberships described above in no way imply a certain level of skill or expertise or that the SEC, FINRA or the SIPC have endorsed Man Investments. Man Investments Inc, 1345 Avenue of the Americas, 21st Floor, New York, NY 10105.

This material is proprietary information and may not be reproduced or otherwise disseminated in whole or in part without prior written consent. Any data services and information available from public sources used in the creation of this material are believed to be reliable. However accuracy is not warranted or guaranteed. © Man 2025