Introduction
We are on contrarian alert. The great Barton Biggs at Morgan Stanley wrote about his plumber providing him with stock trading tips in 1999/2000 as a sign that the speculative bubble was nearing its popping. Are we at a similar stage in the inflation cycle? Inflation is certainly all the rage at dinner parties and in the popular news.
On our own model, US headline CPI will fall from its current 8.5% to 4.0% over the next 12 months. What is more, while a few months ago the lowest estimate at Wall Street was well below 2%, the forecast community is clearly not in denial anymore.
Inflation Is Set to Ease Somewhat Over the Next 12 Months
Figure 1. One-Year Forward Inflation Projection (Headline CPI YoY) with Market Expectations
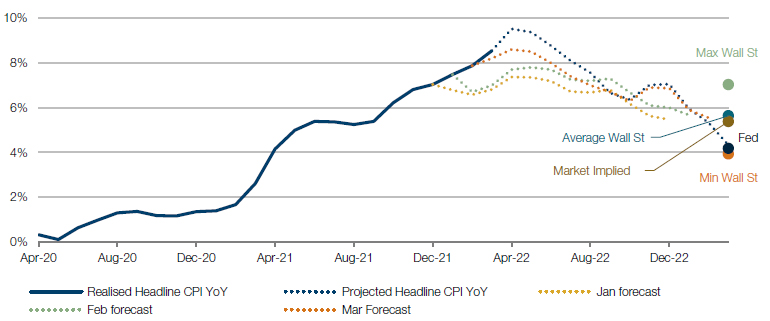
Source: Bureau of Labor Statistics, Professor Shiller, Bloomberg and Man DNA team calculations. As of 28 April 2022.
We model 13 components of the US CPI basket. For ‘Food At Home’ we take a basket of agricultural and livestock futures lagged by 12 months. For ‘Energy’ we use a basket of energy futures, with no lag and use the shape of the forward curve to project. For ‘Shelter’ we lag changes in US house prices by 18 months. For ‘Vehicles’ we use the Manheim Used Vehicle Auction Prices index, lagged by 6 months. For all other categories we assume reversion to the last cycle mean.
Note: Future market and interest rate conditions, among other factors, may affect inflation, and are outside the control of the firm. These future events may materially affect results. Investment decisions should not be made based upon these projections.
While we do expect inflation to ease a bit into year-end…in our judgement the inflation problem is far from over.
This begs two questions: first, is the inflation problem on its way to being solved? And second, what would this mean for asset prices?
On the first question, while we do expect inflation to ease a bit into year-end, courtesy of the base effect, in our judgment the inflation problem is far from over. There is a lack of commodities, labour and housing; Fed fund rates at 50 basis points are still well below neutral, widely estimated to be around 250bps, not to speak of European Central Bank or Bank of Japan rates; and policy goals of climate change, reducing inequality, rebuilding supply chains, tooling back up militarily, as well as the financial repression required to address large debt burdens are all consistent with higher inflation. And we have not even mentioned the continued risk to supply chains of China’s zero-covid policy, and the impact on commodity prices of the ongoing Russia-Ukraine conflict.
History of Inflation
Figure 2 illustrates our best guess of where we are: not at the end of the inflation, but around the middle or even the start.
Figure 2. US Headline CPI YoY, Overlaid With Inflation Regimes and Economic Recessions
Problems loading this infographic? - Please click here
Source: Bureau of Labor Statistics; as of 28 April 2022.
Note: Inflation regimes defined according to The Best Strategies for Inflationary Times, and represent periods where the rate of inflation moves up through 2%, then 5%, and peaks. The red rectangles at the bottom of the chart are periods where the US economy was in recession as defined by the National Bureau of Economic Research.
But still, one should brace for wilder inflation swings in both directions, in this new nascent regime, providing new risks and opportunities. So, in response to popular demand, using the extensive database and method used in our paper The Best Strategies for Inflationary Times, we have looked into the second question: what happens around major inflation peaks historically? As a reminder, our definition is such that the inflation regime ends when the rate has at least halved from its peak. See the paper for more detail about methodology and sources.
We have studied what happens around major inflation peaks (Figure 3).
Figure 3. US Headline CPI YoY, Overlaid with Inflation Regimes and Economic Recessions
Problems loading this infographic? - Please click here
Source: Bureau of Labor Statistics; as of 28 April 2022.
Note: Inflation regimes defined according to The Best Strategies for Inflationary Times, and represent periods where the rate of inflation moves up through 2%, then 5%, and peaks. The red rectangles at the bottom of the chart are periods where the US economy was in recession as defined by the National Bureau of Economic Research.
Figure 4 gives the answers. We show annualised real performance for the major asset classes during inflations, in the last six months up to the eight historical major inflation peaks, and in the subsequent six and 12 months after the inflation peak. We observe the following based on the averages across these eight regimes:
- Traditional assets such as equities and bonds suffer in inflations, and especially so in the last six months up to the inflation peak, when there is some sort of crescendo in the selloff, in part in anticipation of the recession that typically causes inflation to peak. Conversely, commodities, equity Momentum L/S and trend keep on doing well all the way up to the end of the inflationary regime;
- The inflation peak itself coincides with a large turning point to the positive for these same traditional assets of equities and bonds, while commodities and the equity Momentum L/S style make the opposite move, flipping from doing well to doing badly after inflation peaks;
- Five major assets and/or strategies are relatively insensitive to inflation peaking. Four of these keep on doing well before AND after the inflation peak, historically: trend-following strategies, gold, TIPS and equity Quality long/short. And one stops going down after inflation peaks, but without delivering positive real return, on average: high yield.
Asset Performance During and After Inflations
Figure 4. Annualised Real Returns for Inflation Regimes (1926 to Present)
Problems loading this infographic? - Please click here
Source: Equities are the S&P 500 using Professor Shiller’s data. UST10 is from GFD. 60/40 is the monthly rebalanced 60% equity, 40% bonds portfolio. Commodities are proxied by an equal weight portfolio of all futures contracts as they appear through history. From 1926 to 1946 this is based off work done by AQR. From 1946 we use returns from the Man AHL database. Styles are the Fama-French portfolios (Mom., Value (HML) and Size (SMB)), and AQR (QMJ) for Quality. TIPS prior to 1997 based off a backcast by William Marshall at Goldman Sachs, otherwise Bloomberg. HY portfolio constructed by the Man DNA team, using data provided by Morgan Stanley; as of 28 April 2022.
- From Good to Good: Trend Gold, TIPS and Quality
- From Good to Bad: Commods Eq. Mom.
- From Bad to Good: US Equity, UST10, 60/40
- From Bad to Bad: HY
Conclusion
What to do with all this? In brief, also taking the signals from our monthly RADAR1 into account, in addition to the above, we judge that:
- We are not close to a bullish turning point for equities. Regardless of whether inflation is peaking or not, central banks are tightening into a slowing economy while our equity models are not telling us to buy;
- Bond markets may very well be close to a more interesting moment – rates have moved higher, a lot of hawkish news is in the price, and a slowdown in nominal growth is typically good for bonds, not bad;
- The case for Value over Growth in equity funds is not as strong as it has been, in part because inflation, real growth and nominal bond yields may be rolling over for a while.
All in all, now that most people are used to the new normal of rising inflation, Mr Market – so adept at making the biggest fool out of the largest number of people as often as possible – may well be throwing a new curve ball soon.
Higher inflation = more volatility. We should all get used to it.
1. Please contact your relationship manager for more information.
You are now leaving Man Group’s website
You are leaving Man Group’s website and entering a third-party website that is not controlled, maintained, or monitored by Man Group. Man Group is not responsible for the content or availability of the third-party website. By leaving Man Group’s website, you will be subject to the third-party website’s terms, policies and/or notices, including those related to privacy and security, as applicable.