The required return of the top 130 US State Retirement Schemes... continues to be a median 7.0%, which will be incredibly hard to achieve.
The second law of thermodynamics states that the degree of disorder (aka entropy) of any closed system will never decrease going forward in time. In investing, the equivalent might be that the game is never getting any easier. Now more than ever. A host of things investors have benefitted from in recent decades is likely to turn on a multi-year view, we think.
What has not changed is the need to deliver performance. The required return of the top 130 US State Retirement Schemes, for instance, as reported by the National Association of State Retirement Administrators, continues to be a median 7.0%, which will be incredibly hard to achieve (see The Road Ahead #3: The Forgotten Rule for more detail).
Here is our list of eight things investors can no longer rely on, starting with the commonly known, ending with the more esoteric;
1. Traditional assets to deliver strong returns: Starting valuations have eased but are still well above average. For example, the current Shiller PE of 28.9x is 67% above its long-term average of 17.3, and nominal rates are still well below nominal trend growth. In addition, we know that traditional assets perform badly in times of high and rising inflation. What is more, investors are still heavily invested in a portfolio of traditional assets;
2. Bonds to diversify equity risk: Stock-bond correlations have almost always been positive during 3-year periods of average core CPI exceeding 2.7%, empirically. This is due to the fact that when inflation is high, higher inflation is bad for both equities and bonds;
3. Attractive Sharpes from portfolios of traditional assets: This follows straight from the aforementioned points, but we feel it merits its own bullet point. Occasional monster rallies notwithstanding, a static portfolio of traditional assets will deliver more volatility and less performance;
4. Generic factors to perform consistently: McLean and Pontiff (2012) already calculated the alpha decay in factor returns from in-sample testing to post-publication as 58% (Figure 1). Of course, more computing power, new data and new techniques have extended alpha possibilities in recent years. And while we expect hedge funds can continue to extract alpha from certain inefficiencies and behavioural features, especially those that are on the cutting edge of alpha innovation, continuous alpha decay means the game is getting ever harder;
Figure 1. Significant Alpha Decay After Factor Discovery1
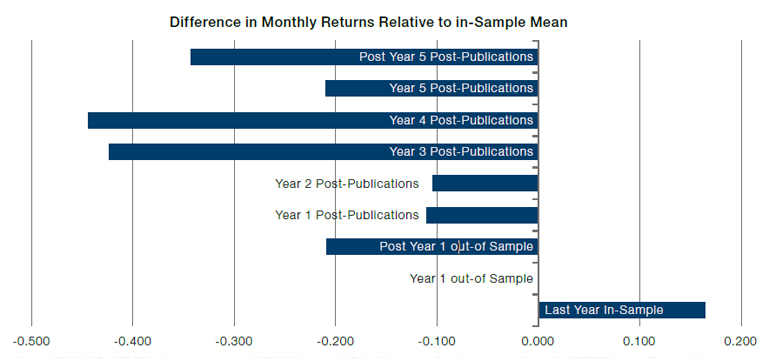
Source: McLean and Pontiff; as of 2012.
5. Hedge fund managers to deliver above-average performance: Figure 2, provided to us by our colleague Richard Barclay, shows a steady decline in the rolling 5-year and 10-year alpha of the HFRI Equity Hedge Index over the MSCI World Index, measured as return over and above beta. We speculate that, in addition to the previous point, the strongest driver has been the move to passive: as the market share of passive investment has gone up, the weaker active investors have been squeezed out, thus leaving the remaining investors with stronger competition and a harder job to come out winning in the zero-sum game that is pure alpha;
Figure 2. Where Has The Aggregate Hedge Fund Alpha Gone?
Problems loading this infographic? - Please click here
Source: HFRI, MSCI, Man FRM; as of 31 July 2022.
6. Especially for our Australian friends - AUD weakness in global equity market corrections: While many believe AUD weakens in equity market corrections due to its correlation with equities, we have found that the Australian dollar almost always mirrors the direction of commodity prices in equity market corrections. If indeed equity market corrections will more frequently be driven by higher inflation, consistent AUD weakness would disappear, taking away a beneficial feature through the translation effect to investors down under (Figures 3, 6 and 7);
Figure 3. In Equity Corrections, the Australian Dollar Has Been Closely Linked to Commodity Prices
We included all 10%+ S&P 500 equity market corrections since 1970. Every bubble represents one of those corrections. See the table in the appendix for the full list.
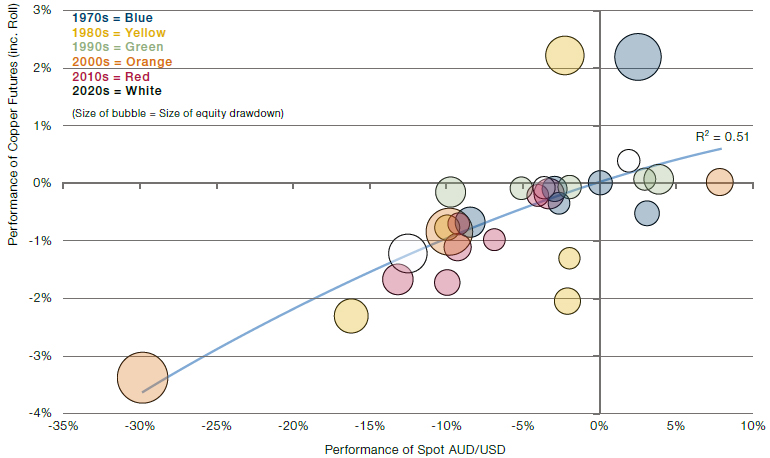
Source: Bloomberg, Man AHL, Man Solutions; as of 31 July 2022.
7. A Negative Correlation Between USD and Oil: Now that the US is no longer a net importer of oil, oil and the dollar could go up and down together. While unusual in recent memory, this would be a return to the same positive correlation that occurred between 1985 and 2000 (Figure 4). This as well as the next observation originate from a note by our friend and former colleague Gerard Minack from Minack Advisors, and we thank him once again;
Figure 4. Oil Price and USD TWI
Problems loading this infographic? - Please click here
Source: Minack Advisors; as of 31 July 2022.
8. EM equities to underperform during periods of USD strength: Selected commodity-producing EM equities could be capable of outperforming during stronger periods for the US dollar, if indeed strong commodity prices do coincide with dollar strength. This was a feature for a while in the 1980s and the early 1990s (Figure 5). This would be true for commodity producers only, as EM countries in need of funding would still suffer from the pressures of a stronger dollar.
Figure 5. USD and Relative Performance of EM Equity
Problems loading this infographic? - Please click here
Source: Minack Advisors; as of 31 July 2022.
Figure 6. Copper Has Historically Been a Good Bellwether for Australia’s Commodity Exports and Has Consistent Data Since 1970
Problems loading this infographic? - Please click here
Source: Bloomberg, Man AHL, Man Solutions; as of 31 July 2022.
Figure 7. Commodity and AUD/USD Performance During Equity Drawdowns
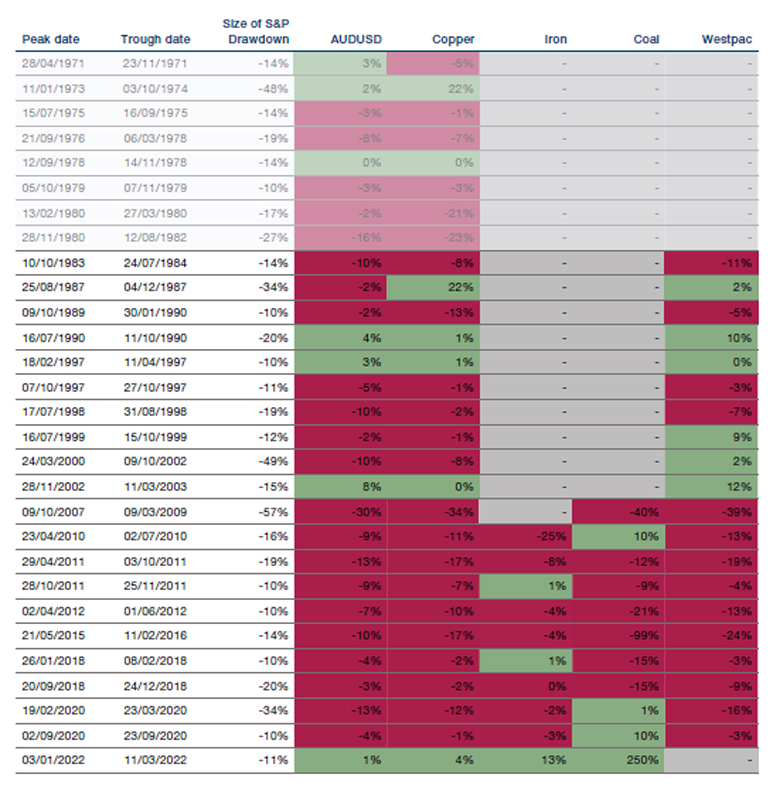
Source: Bloomberg; as of 03/08/2022. S&P and AUD data is total return and spot respectively. Copper, iron and coal are near end futures performance taken from Man AHL’s database, and includes a roll component. Westpac is the Westpac export weighted basket of commodities produced by Australia. Note: AUD was managed to follow GBP until 1967, then USD until 1974; then a basket of currencies until 1983 after which it became free-floating.
1. From McLean and Pontiff (see link in item (4)). The chart plots the coefficients from a regression containing dummy variables that signify the last 12 months of the original sample; the first 12 months out of sample; and the other out of sample months. In addition, the publication dummy is split up into six different variables; one dummy for each of the first five years post publication, and one dummy for all of the months that are at least five years after publication.
You are now leaving Man Group’s website
You are leaving Man Group’s website and entering a third-party website that is not controlled, maintained, or monitored by Man Group. Man Group is not responsible for the content or availability of the third-party website. By leaving Man Group’s website, you will be subject to the third-party website’s terms, policies and/or notices, including those related to privacy and security, as applicable.