Key takeaways:
- The 1970s and 1990s are the most mooted market parallels of the moment. Are those fair analogues? Which is more likely?
- Let’s also not forget the potential for a garden-variety recession
- ‘Meh’ is, in my view, an unlikely 2025 outcome. You can make a strong argument for a very bad year and build a similarly competent case for a very good one. Push me off the fence and I’ll fall for the former
You’re so damn hard to please, We gotta kill this switch. You’re from the ‘70s, But I’m a ‘90s –––––
Icona Pop (feat. Charli XCX)
There seems to be a split in the commentariat opinion as to whether the 1970s or 1990s offer the clearest parallel to where we are just now. More inflationary waves or still early in a valuation euphoria? I think there are echoes of both in the current setup, but if I have to choose I’m going for the former. Here’s why.
Barring a cataclysmic year end, we will have had two consecutive years with the S&P 500 north of 20%. Indeed, at the time of writing, the US benchmark is up 29% year-to-date in total return terms. Given the positive seasonality it seems likely we get back-to-back +25%. In the last 225 years, there have been 15 instances of sequential +20%s, and six if we make the threshold +25%. Figure 1 gives some summary statistics for each of these scenarios.
If this was all you had to go on, you’d say the base case for 2025 was a below-average year (mean and hit rate below unconditional in both scenarios). But with a sting in the right tail as well as the left. In other words, banner hattricks do exist. And indeed more. 1994 to 1998 was four sequential +20%. And 1999 was +19%. We all know how that ended. It’s just that your past self didn’t know when.
We are at an unusual juncture, in other words. You can make a strong argument for a very bad year. You can build a similarly competent case for a very good one. Below I outline some useful parameters for thinking about this 2025 crossroads. 2024 was a chastening year for those, like me, with a more bearish view. And so, at least initially, I’ll leave the reader to make up their own mind. But prediction is addictive, so as I conclude, I’ll put up another hostage to fortune.
Figure 1: Summary statistics for the year following consecutive +20% and +25% S&P 500 years
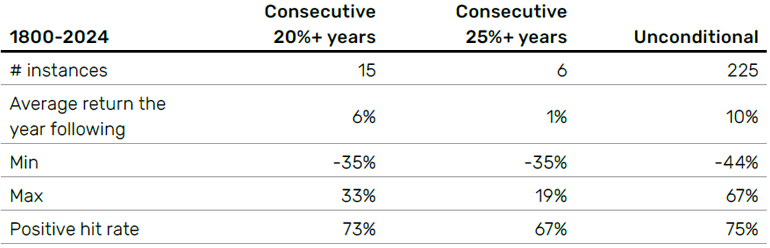
Source: Bloomberg, Shiller, Man Group calculations, as of 9 December 2024.
Is it the 1990s all over again? Oasis are back and a game-changing technology is the talk of the town. And just like then, the curmudgeons are warning that we’re all getting a little too excited. So damn hard to please. Figure 2 shows a measure of the US equity risk premium (ERP), calculated as the prospective earnings yield on the S&P 500, minus that of the 10-year US Treasury (UST10). We are close to zero – indeed we reached flat intra month in November. That is an important (expensive) threshold. Imagine a conventional risk-off event: call it UST10 dropping to 3.3% and the ERP reverts to long-run median (the middle horizontal dashed line in Figure 2), where we were as recently as 2022. Even making the wildly optimistic assumption that current earnings expectations (US$268) were static, that would entail a price decline of 26%.
But the 90s precedent is a tricky one. Back then the ERP first hit zero in April 1996. If you had been using that as your sell signal you’d have missed out on +143% performance to the bubble’s peak. The resulting crash was ‘only’ 47%. Teach you to be so clever. To give you some sense of the quantum this time around, let’s suppose the artificial intelligence (AI) mania takes the ERP to -200bps (peak DotCom was -250bps), and the 10-year moves to 5.4% (current theoretical fair value yield, as we will later discuss), that would entail a further +31% return to the S&P 500.
Problems loading this infographic? - Please click here
How to hold onto that balloon while hedging your bets? In the bursting of the DotCom bubble, Value offered a compelling answer. Between March 2000 and October 2002, the equity return was -47%. The return to Value Long/Short (L/S) (proxied by Morgan Stanley’s US L/S basket) was +441%. On those numbers even a 90/10 split to S&P long-only and Value L/S would have returned +1.8% through one of history’s great stock market busts. Figure 3 shows the gap in price-to-earnings (P/E) points between MSCI USA Growth and Value. The DotCom mania and 2020/21 episode (a combination of the Covid disruptions and the meme-stock/SPAC mania of 2021) are the only bigger spreads than at present. I’ll leave you to do your own mental maths around potential returns to Value if we revert to the average gap, but suffice to say, these kind of strategies are worth further investigation if you believe that AI mania goes south.
Problems loading this infographic? - Please click here
There are also some nasty 1970s echoes around. Not least of which that disinflation hasn’t been as clear a narrative as some commentators suggest. US headline CPI year-on-year peaked at 9.1% in June 2022. In the 12 months following that print (to June 2023), prices rose 3.0%. In the next 12 months (to June 2024) it was also 3.0%. Your reminder that three is not two. Admittedly in the four months since then, the figure has moderated, to 2.6%. But still above target.
Figure 4 shows US headline CPI broken out into component parts. Since the June 2022 peak, shelter and core services excluding shelter are virtually unchanged in their contributions. 81% of the disinflationary pressure has come from autos, energy and food. There is an important core of price pressure, in other words, which is not following the disinflation script.
Problems loading this infographic? - Please click here
Here’s the crossroads. If inflation continues to moderate, indeed, even staying at its current run rate would likely do it, then the cutting cycle can continue, and that could be good news for bonds. In Figure 5, I show prior cutting and hiking cycles, with some summary statistics for each regime. On average, during a loosening period, the total real annualised return for the 10-year Treasury is +17%. It is always positive and has never been less than +9%. Since August, when this native (and possibly abortive) cutting zone began, we are running at -1%. If this is a conventional slowdown, or even the 90s (but the end rather than the start), then this is a great time to amp up duration. If we are in 70s version 2.0… or the false starts of the mid-90s… or 2022… it’s not.
Figure 5: US monetary policy cycles (top) and summary statistics (bottom)
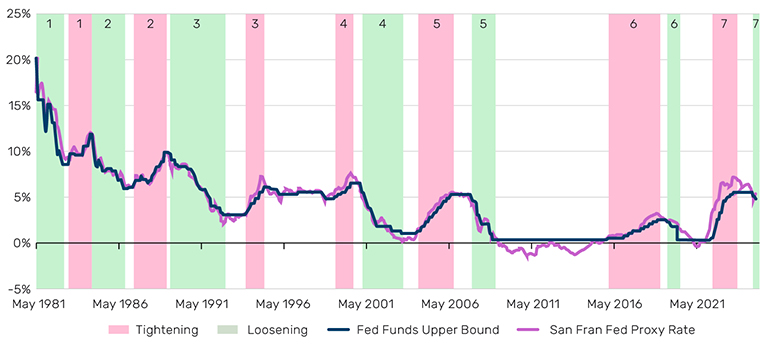
Source: Various. All monetary policy data from Bloomberg. US equities is S&P 500, Commodities is GSCI, Trend is Man Group proprietary data. Value and XS Mom. are Fama French factors. All calculations by Man Group. # moves assumes each Fed move is 25bps. As of 9 December 2024.
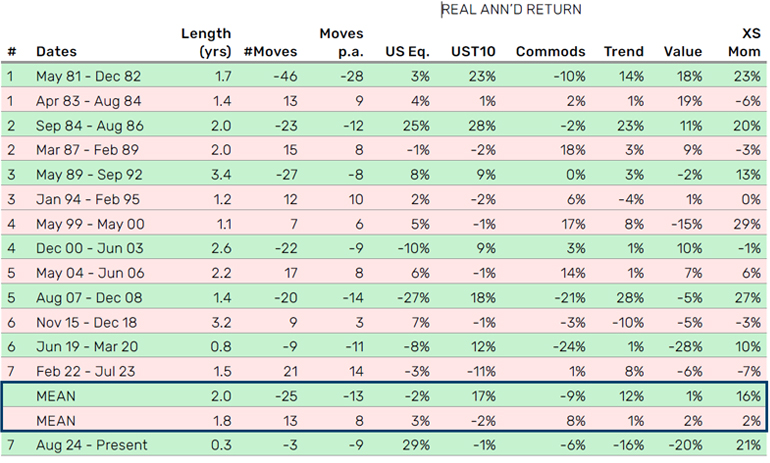
Even if 2025 does end up suiting bonds, there are reasons for longer-term structural concerns. Figure 6 shows a framework that regular readers will have seen many times: theoretical fair value yield as the sum of trend growth, inflation expectation and the term premium. The shaded areas of the chart show an average of various measures of each – see the footnote for full details – summing to the navy blue line, which we compare with the purple line, being the actual traded yield.
Theoretical fair value yield is higher than the US government pays. That has (virtually) always been the case, as shown in the bottom panel of Figure 6. The exorbitant privilege of being the world’s reserve currency, the unit of account for most commodities, and of having the deepest, most liquid capital markets, mean that many actors buy US Treasuries for non-economic reasons. That benefit has historically been worth 200bps on average (the middle dashed horizontal line of the bottom panel). Today it is a meagre 120bps, around the 25th percentile (lower dashed line).
There is admittedly a bull case for bonds here as well. If the de-dollarisation story is pub chat only, then we could revert to the long-run median spread. That would entail the UST10 yield moving down to 3.3%, assuming trend growth, inflation expectations and the term premium stayed constant. By my reckoning that would come to an estimated +12% total return, assuming it transpired over 12 months. And you could double that if we get a conventional slowdown (where we go to the 75th percentile spread, the upper dashed line of the bottom panel, and the fair value components fall), of which more below.
But on the other hand, if US exceptionalism does come into further question – and based on present evidence this may feel unlikely – then a zero spread could equate to -5% in performance terms. Moreover, the fair value components could continue the upward trend they have been on over the past four years. Inflation expectations could adjust higher if the 70s playbook evolves as discussed above, while the term premium should arguably be much higher if it is to be consistent with its historic relationship with measures of interest rate uncertainty.1
Figure 6: US 10-year Treasury yield and theoretical fair value yield since Global Financial Crisis (top) and spread over long term (bottom)
Source: Bloomberg, Man Group calculations. For Trend Growth we take the average of Laubach-Williams R*, Richmond Fed R*, LaubachWilliams Trend Growth, the 5-year moving average of realised real GDP growth, and the Street’s long term growth estimate. For Inflation Expectation we average the University of Michigan’s long run estimate, the Cleveland Fed’s 10-year estimate, the 5Y5Y, the 10Y breakeven, the 5-year moving average of realised HL CPI, and the Street’s long run inflation estimate. For the Term Premium we average the ACM, KimWright and San Francisco Fed estimates. As of end November 2024.
In all the talk of the 70s or 90s let’s also not forget the potential for a garden-variety recession, as just alluded to. This has not been a particularly strong cycle, at least not so much as to justify the kind of uplift in expectations for equity returns we have seen. Figure 7 shows real earnings and the ISM Manufacturing purchasing managers’ index (PMI) for this cycle, along with the historic range. The pattern of a conventional economic expansion is for real earnings to rise linearly, to +25% four-fifths of the way through, and then roll over in the latter stages of the business cycle, usually as inflationary concern intensifies. In terms of aggregate activity (i.e. the ISM, the bottom panel), the general picture is an intense period of improvement in the first third (ISM on average moving from 40 to 60), before a long decline toward the classic recession threshold of 45, over the remaining two thirds.
The cycle that began in 2020 started with an 18% inflation-adjusted earnings decline from April 2020 to April 2021, as the pandemic disruption continued to plague bottom lines, even as the recovery was underway. The reopening boom was then reflected in real earnings per share (EPS) up 44% through to August 2022. But since then, nominal EPS on a trailing 12-month basis have moved from US$222 to US$239, while general prices have risen 7%, coming to a real increase of just 0.5%. For all the breathlessness around (a) a few stocks and (b) expected nominal profits, the reality is that, in aggregate real realised terms, nothing has happened for two years.
Meanwhile, the ISM has traced a typical pattern for a full expansion and, despite a small recovery in last month’s read, trades at exactly the level where we have historically seen cycles end. Again the sense of a binary outcome. We’re either very late in the cycle. Or very early. Or it’s a very strange cycle.
Figure 7: Real earnings growth (top) and economic activity (bottom) – this expansion versus prior expansions
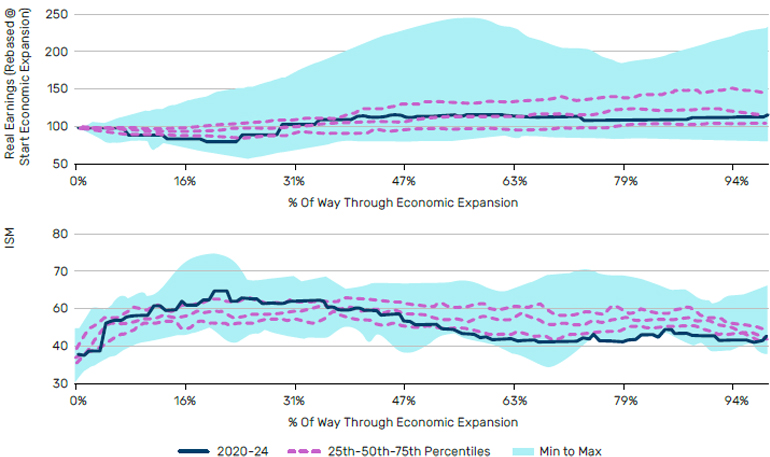
Source: Bloomberg, Man Group calculations, as of end November 2024.
‘Meh’ is the most unlikely 2025 pathway, in my view. I can see a 1970s scenario of dormant, not dead, inflationary pressures reawakening. Both the equity and bond markets freak like it’s 2022. But equally, it’s conceivable we get more market-good Trump (deregulation, tax cuts, government efficiencies, Ukraine peace deal) than market-bad (policy volatility, tariffs, labour market restrictions), and then we could party like it’s 1996. Time to get off the fence. Like Charli, I’m a child of the 90s, but my instincts for 2025 are more toward the former, more pessimistic, 1970s vision. While acknowledging that that right tail is higher chance than normal. My ideal liquid assets portfolio looks something like this.
Figure 8: Example 2025 portfolio
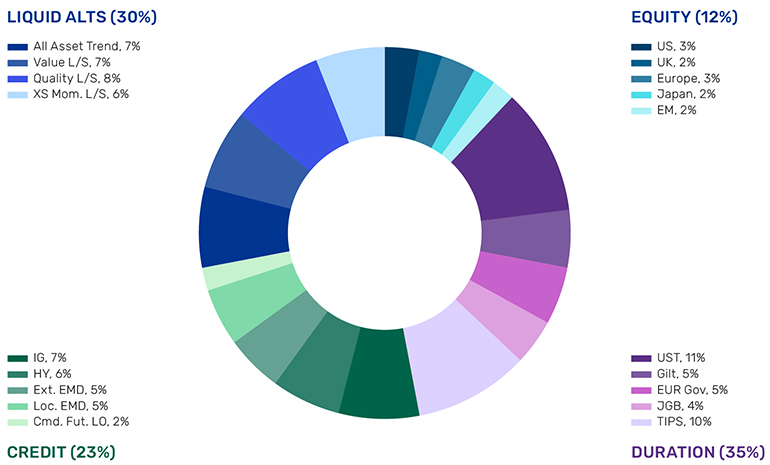
Source: Man Group. Any descriptions or information involving investment process or strategies is provided for illustration purposes only, may not be fully indicative of any present or future investments, may be changed and are not intended to reflect performance.
A final note before I leave you to your figgy pudding (we all want one). There were 14 occasions, where US stocks and bonds were both down over the calendar year. Figure 9 lists them, with some commentary around what was going on. Those, like me, with a nerdy interest in financial history can peruse at their leisure. For the majority who can’t be bothered, here’s a list of nine things that recur:
1) FX volatility (1836, 1890, 1931)
2) Liquidity restrictions (1836, 1857)
3) Fiscal sustainability concerns (1839, 1841, 1846, 1865, 1917, 1969)
4) Beginnings and endings of wars (1846, 1857, 1865, 1917, 2022)
5) Changes in tariff regimes (1846, 1890, 1931)
6) Political polarisation (1841, 1865, 1876, 1877, 1969)
7) Financial market manias (1857, 1907, 1969, 2022)
8) Inflation concern (1839, 1865, 1890, 1969, 2022)
9) Bank runs (1857, 1907, 1931)
“The sun also ariseth, and the sun goeth down, and hasteth to his place where he arose… and there is no new thing under the sun.”
Figure 9: Calendar years where US stocks and bonds have both been negative
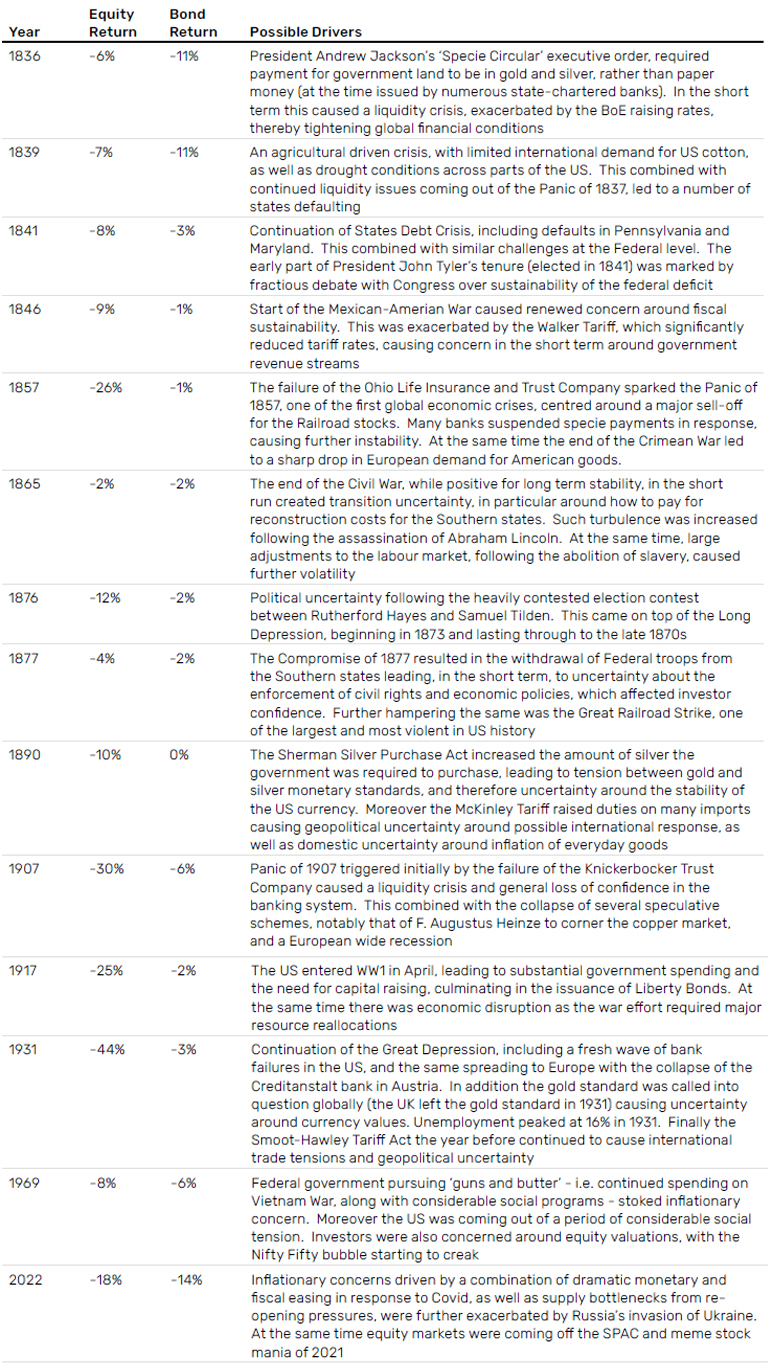
Source: Man Group
Now, time to kill this switch. Wishing you a very happy Christmas and prosperous 2025.
1. See: https://www.man.com/maninstitute/road-ahead-term-premium
Any opinions, assumptions, assessments, statements or the like (collectively, “Statements”) which are forward-looking, with regards to the market or asset class, constitute only subjective views, beliefs, outlooks, estimations or intentions of the speaker, and are subject to change due to a variety of factors, including fluctuating market conditions and economic factors.
You are now leaving Man Group’s website
You are leaving Man Group’s website and entering a third-party website that is not controlled, maintained, or monitored by Man Group. Man Group is not responsible for the content or availability of the third-party website. By leaving Man Group’s website, you will be subject to the third-party website’s terms, policies and/or notices, including those related to privacy and security, as applicable.