Low Volatility, Large Performance Dispersion
After a brief rough patch of underperformance following the onset of Covid, low-volatility strategies have gained traction recently. With market volatility currently hovering at elevated levels, downside risk mitigation is again a high priority to many investors as they seek a defensive positioning. Against this backdrop, low-volatility strategies have seen a revival both in terms of performance1 and inflows (Figure 1).
Figure 1. Cumulative S&P 500 Low Volatility ETF Fund Flows, May 2011 to December 2022
Problems loading this infographic? - Please click here
Source: Man Numeric; as of 31 December 2022.
Low vol has become an increasingly varied investment product with large performance divergence observed among fund managers.
Yet “low vol” is not a homogenous category; it has become an increasingly varied investment product with large performance divergence observed among fund managers, according to data from eVestment (Figure 2). The low-vol strategy first became popular after the GFC as it demonstrated superior downside protection during the crisis.2 The number of fund managers offering low-vol products duly rapidly increased in the years after the GFC. This expansion nevertheless slowed and eventually stalled. Interestingly, while we saw few low-vol funds being launched in recent years, the return dispersion among managers has steadily increased since 2017. In annualised terms, the dispersion (as defined as the standard deviation of excess returns of managers) rose from 2.1% in 2019 to more than 4% in 2022, which was the highest level since the GFC.
Figure 2. Statistics of Global Low Vol Fund Managers, 2009-20223
Problems loading this infographic? - Please click here
Source: eVestment; as of 31 December 2022.
The recent trend naturally poses challenges to allocators when it comes to evaluating the performance of low-vol funds. As an attempt to solve the puzzle, in this article we highlight several implementation details that are easily neglected in interpreting low-vol portfolio performance and discuss key components in the portfolio construction process that we have historically found to have significant impact on low-vol portfolios.
Don’t Judge a Low Volatility Portfolio by its Appearance
With no doubt, portfolio return relative to standard market indices is one of the most important dimensions in evaluating low-vol portfolios. That said, an overemphasis on portfolio returns without considering various risk characteristics of low-vol portfolios can often lead to biased conclusions. To illustrate this point, we consider two low-vol managers and their track records found in the eVestment database.
For the period between 2014 and 2022, Manager A and Manager B generated similar levels of annualised returns, both slightly underperforming the MSCI World Index (Figure 3). However, after regressing the historical monthly returns of the two funds on the index returns, we noted that the two low-vol managers had very different Betas. With a Beta of 0.76, Manager A is more exposed to market risk than Manager B, who has a lower Beta of 0.59. From a risk-adjusted basis, both managers outperformed a beta or risk-adjusted index. However, the outperformance of Manager B (5.6%) was substantially higher than Manager A (2.6%).
Figure 3. Annualised Excess Return (with Beta Adjustment), 2014-2022
Problems loading this infographic? - Please click here
Source: eVestment; as of 31 December 2022.
Figure 4. Downside vs. Upside Participation, 2014-2022
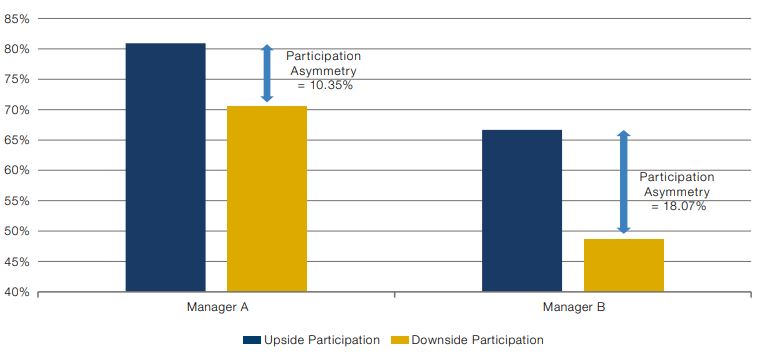
Source: eVestment; as of 31 December 2022.
Opportunities Are in the Details
A natural next question for us to ask is what exact components in the low-vol portfolio construction process have been driving the varied performance we observed among low-vol portfolios. There are two major approaches to constructing low-vol portfolios. The naïve approach applies an inverse volatility weighting scheme to a subset of stocks with the lowest volatility in the stock selection universe, while more sophisticated approaches utilise minimum variance optimisation techniques that take stock correlations into account. In this article, we focus our discussion on the optimisation-based approach as it involves more technical nuances that could lead to differentiated low-vol portfolios.
Capitalising on Man Numeric’s experience in managing low-vol portfolios, we noted four components in the portfolio construction process that, if handled correctly, can potentially be additive to generic optimisation-based low-vol portfolios (e.g. the MSCI World Min Vol Index):
1. Turnover: To reduce replication cost, MSCI World Min Vol follows a semi-annual rebalance schedule with its annualised turnover capped at 20%. Relaxing the turnover constraint and allowing more frequent rebalances of the portfolio enables low-vol portfolios to respond more swiftly to rising risk, especially during extreme market environments.
2. Risk Control: MSCI World Min Vol relies on a Barra risk model for risk forecasts. While the Barra model captures a comprehensive set of risk factors, we believe it is too rigid to deal with event-driven risk or small pockets of risk. Therefore, incorporating additional risk models could help improve the risk forecast of low-volatility portfolios and tighten risk controls.
Seeking enhanced returns and downside protection are not necessarily at odds with each other.
3. Factor Overlay: Seeking enhanced returns and downside protection are not necessarily at odds with each other, meaning that it is possible to improve the upside participation of low-vol portfolios through a factor overlay while maintaining a defensive stance.
4. Transaction Cost: While higher turnover potentially allows low-vol portfolios to be more responsive to evolving risks, it could also lead to higher transaction costs. Integrating transaction costs as part of the portfolio optimisation problem can help avoid excessive churning of low-vol portfolios.
To further illustrate the impact of these components, we create a set of hypothetical portfolio simulations with different portfolio construction rules. In Simulation 1, we relax the turnover constraint of MSCI World Min Vol and rebalance the portfolio at a weekly frequency. On top of that, we combine a secondary principal component risk model with the Barra risk model in Simulation 2 to tighten risk controls. In Simulation 3, we further include a multi-factor overlay of a blend of value, momentum and quality models to seek to enhance portfolio returns. Finally, in Simulation 4, we integrate our in-house transaction cost model as part of the portfolio optimisation process.
With that, we review the performance of these hypothetical portfolios during the recent market environment. The first three quarters of 2022 were characteristically risk-off as the broad equity market suffered a significant drawdown. During this period, the MSCI World Min Vol Index experienced a smaller drawdown compared with the standard index (Figure 5). Meanwhile, Simulations 1, 2 and 3 saw progressively higher returns than the Min Vol Index as the relaxation of turnover constraint, tightened risk control and the alpha overlay all contributed positively. Notably, the factor overlay contributed the most to performance (3.4%) during the risk-off environment, which makes intuitive sense as the value tilt likely helped the portfolio stay away from expensive low-vol stocks. The incorporation of the transaction cost model, however, slightly detracted from performance.
From a risk perspective, all four simulated portfolios have lower annualised volatility than the Min Vol Index, with Simulation 1 being the least volatile portfolio. Interestingly, as the portfolio with the highest absolute return, Simulation 3 managed to have lower annualised volatility and comparable Beta exposure to the Min Vol Index, indicating that the return enhancement was indeed driven by superior stock selection as opposed to taking on more systematic risk.
Figure 5. Simulated Low Vol Portfolio Performance during Risk-off Environments
Problems loading this infographic? - Please click here
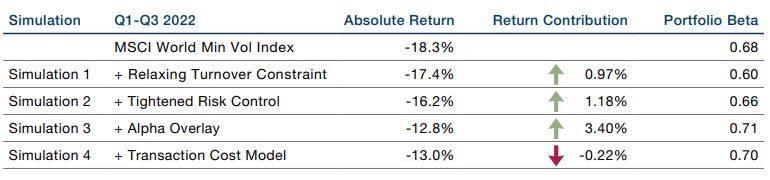
Source: MSCI; as of 30 September 2022. The periods highlighted are exceptional and the results do not reflect typical performance. The start and end dates of such events are subjective and different sources may suggest different date ranges, leading to different performance figures. Simulated results are gross of any fees or expenses which could materially reduce returns. Please see the important information linked at the end of this document for additional information on hypothetical results.
Unlike the first three quarters of 2022, the broad equity market became more riskon in the fourth quarter and eventually culminated with a massive risk rally in January this year. Traditionally, risk-on environments are challenging for low-vol portfolios as low-volatility stocks struggle to keep up with the broad market. As a result, the Min Vol Index lagged the standard index during this period (Figure 6). However, we continued to see added value from the relaxation of turnover constraint, tightened risk control and the transaction cost model during this challenging environment, indicating that low-vol strategies equipped with the right portfolio construction setting are able to navigate unfavourable environments more smoothly than generic implementations of low vol.
Figure 6. Simulated Low Vol Portfolio Performance during Risk-on Environments
Problems loading this infographic? - Please click here
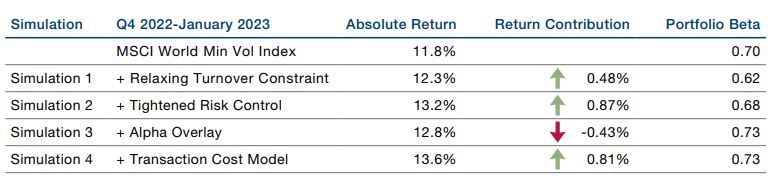
Source: MSCI; as of 31 January 2023. The periods highlighted are exceptional and the results do not reflect typical performance. The start and end dates of such events are subjective and different sources may suggest different date ranges, leading to different performance figures. Simulated results are gross of any fees or expenses which could materially reduce returns. Please see the important information linked at the end of this document for additional information on hypothetical results.
Conclusion
We are confident that differentiated low-vol portfolio construction approaches will be able to help investors more efficiently harvest the low-vol anomaly.
In this article, we discuss why low vol in recent years has become a less homogenised investment product and how generic implementations of low-vol portfolios can potentially be improved with appropriate portfolio construction techniques. Given the latest developments in global economies, elevated market volatility will likely persist in the foreseeable future. At Man Numeric, we view this as an opportunity for low-vol portfolios to shine. We are also confident that differentiated low-vol portfolio construction approaches will be able to help investors more efficiently harvest the low-vol anomaly compared with generic implementations of low-vol portfolios.
1. See performance of MSCI World Min Vol Index versus MSCI World Index in Figure 5.
2. The maximum drawdown of the MSCI World Index was 57.46% from 31 October 2007 to 9 March 2009, while the equivalent figure for the MSCI World Minimum Vol Index was 47.73% (Source: MSCI ; as of 28 February 2023).
3. In this analysis, we focus on quant managers in the eVestment Low Vol universe whose benchmark is either MSCI World Index or MSCI World Min Vol Index.

You are now leaving Man Group’s website
You are leaving Man Group’s website and entering a third-party website that is not controlled, maintained, or monitored by Man Group. Man Group is not responsible for the content or availability of the third-party website. By leaving Man Group’s website, you will be subject to the third-party website’s terms, policies and/or notices, including those related to privacy and security, as applicable.