Executive Summary
As global carbon emission policies and regulations become increasingly stringent, the costs associated with carbon emissions are expected to rise significantly. In light of this evolving landscape, investors are paying close attention to carbon emission data as a crucial factor in their investment decision-making. One potential investment signal that has gained as much traction as it has controversy is carbon emission intensity, which measures a company’s disclosed carbon emissions (typically Scope 1 and Scope 2) divided by its revenue. In this paper, we highlight a missing link in the use of carbon emission intensity as an alpha signal and underscore the importance of considering the effective carbon price, which varies greatly across regions, industries and emission scopes.
The Investment Hypothesis Behind Carbon Emissions Intensity and Its Controversies
Companies with higher emissions intensity are hardest hit in the face of an increase in carbon prices and therefore should have more downward earnings revisions and ultimately lower returns.
Formalising the investment thesis behind carbon emissions, we will examine its various implications and test them empirically. The economic channel connecting carbon intensity to investment returns is illustrated in Figure 1. Essentially, tightening carbon emissions policies leads to an increase in carbon pricing which takes the form of carbon tax, fuel excise tax or emissions permits. As the cost of emissions rise, a company’s expected earnings can be subsequently impacted. This is because companies pay for increased emissions costs either explicitly or implicitly. Those companies with higher emissions intensity are thereby hardest hit in the face of an increase in carbon prices and therefore should have more downward earnings revisions and ultimately lower returns.
Figure 1. The Economic Channel Connecting Carbon Intensity to Investment Returns

Source: Man Numeric.
Despite the simplicity of the above investment logic, carbon emissions intensity has caused significant controversy in the literature (see Venturini 2022 for a review).1 Due to weak empirical evidence in the form of risk-adjusted excess returns, critics argue that carbon emission intensity should be viewed as a risk factor and not as a source of alpha.
The Missing Link: Carbon Pricing Varies Greatly Across Regions, Industries and Emission Scopes
Not all carbon emissions are equal. One should not ignore these essential details of carbon pricing when evaluating carbon emissions intensity as an investment signal.
Using the OECD effective carbon rate data, we make one crucial observation: not all carbon emissions are equal. There is significant dispersion in carbon pricing across different regions, industries and emission scopes. If the investment thesis outlined above is correct, one should not ignore these essential details of carbon pricing when evaluating carbon emissions intensity as an investment signal.
The OECD effective carbon rate data is consolidated by reviewing country-specific policies and carbon prices across sources of emissions, such as fuel tax, emissions permits, carbon tax etc. It reflects the cost of emissions for a given activity for companies in each country, which allows us to map a company’s scope-specific emissions to the corresponding prices. The effective carbon rate, quoted in EUR per metric ton of CO2, ranges from 0 to more than 300 across OECD countries and emission types. For example, when viewed across regions, companies within Europe face the highest relative effective carbon prices compared to the rest of the world, reflecting the higher carbon tax, fuel tax or emissions permit prices. Drilling down further, northern Europe has higher effective carbon prices than southern or eastern Europe, reflective of the respective carbon policies in the region.
Figure 2. Distribution of OECD Effective Carbon Price Pooled Across Country, Regions and Emissions Type
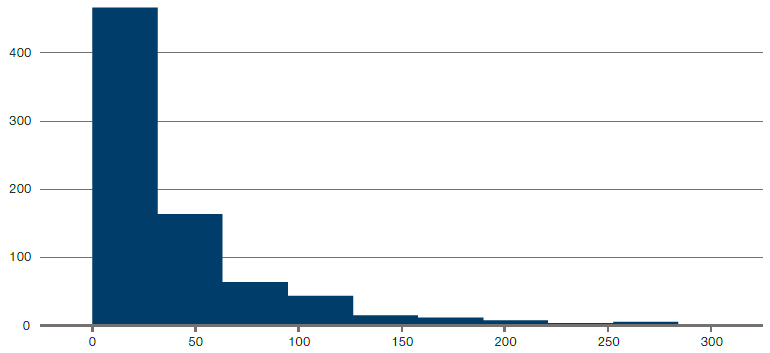
Source: OECD, as of 30 June 2023.
Figure 3. Effective Carbon Price Ranking Across the World
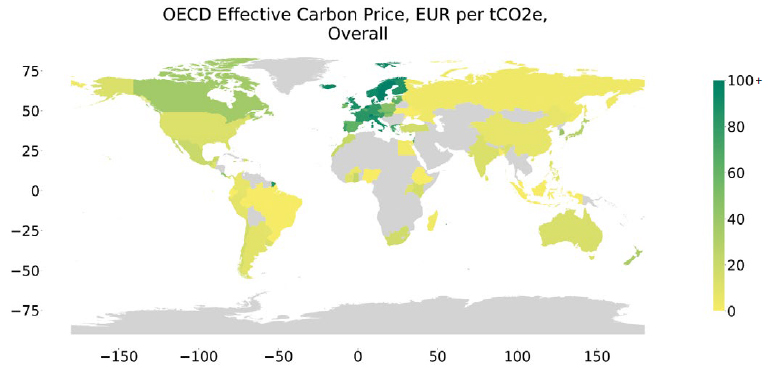
Source: OECD, as of 30 June 2023.
The effective carbon price varies greatly across countries, industries and emission scopes.
The effective carbon price also varies greatly across industries. In China the effective carbon price in the road transportation industry (Figure 4) is relatively high compared to the rest of the world. This is reflective of China’s policy which heavily penalises emissions from road transportation as the country invests strongly in high-speed rail networks. However, China’s effective carbon price on industrials is relatively low compared to the rest of the world (Figure 5). Since industrial emissions are a significant part of China’s total emissions, the overall effective carbon price for companies in China is relatively low compared to the rest of the world.
Figure 4. Effective Carbon Price Ranking for Road Transportation
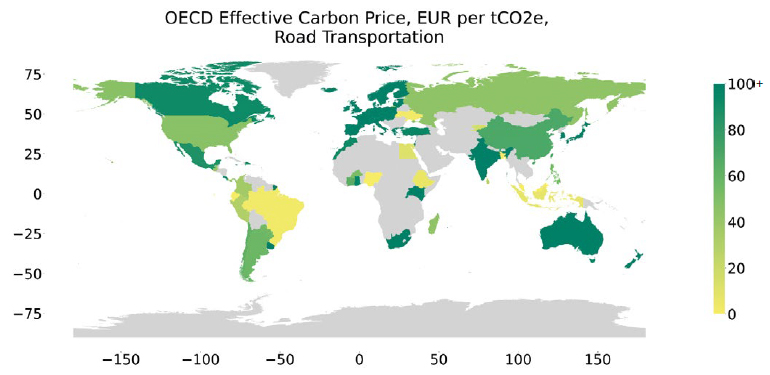
Source: OECD, as of 30 June 2023.
Figure 5. Effective Carbon Price Ranking for Industrials
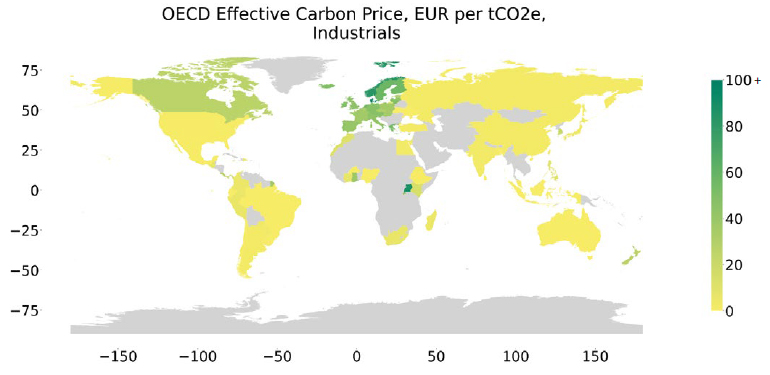
Source: OECD, as of 30 June 2023.
Effective Carbon Pricing Leads to Granular Scope-Specific Costs of Emissions
The above OECD effective carbon prices are the economic activities associated with carbon emissions. At the company level, Scope 12 and Scope 23 are often classified as different economic activities and hence are priced differently. In most cases, Scope 2 emissions are associated with electricity consumption, while Scope 1 will depend on the company’s business. Using a trucking company and a rail company as an example, although the sum of Scope 1 and Scope 2 emissions intensity are similar, the sum of associated costs are rather different. This is owing to the differences in the proportion of the companies’ emissions which are classified as Scope 1 and Scope 2.
Figure 6 outlines some examples of how this works in practice. When looking at the total emissions intensity, the US train freight company has slightly higher total emissions intensity than the US trucking company. When used as an alpha signal, the carbon emissions intensity will favour the trucking company, because it has slightly lower total emissions per dollar of revenue generated. However, when looking at the total cost intensity, because the effective carbon price for the US train freight company’s scope 1 emissions is much lower than that for the trucking company’s scope 1 emissions, the train freight company is preferable.
Figure 6: Applying Effective Carbon Price to Scope 1 and Scope 2 Emissions
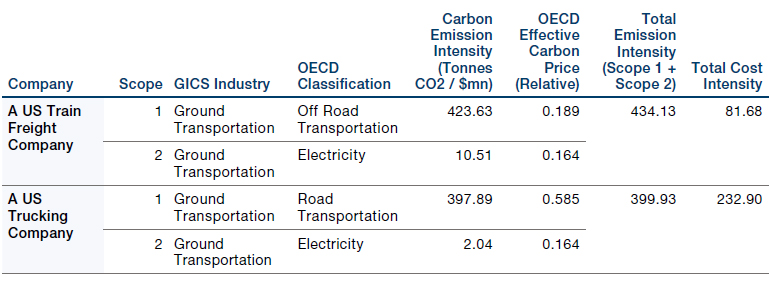
Source: Man Numeric, S&P Trucost Limited © Trucost 2023, as of 30 June 2023.
Effective Carbon Price Validates Our Investment Thesis
One can derive a cost-based intensity by considering the granular effective carbon prices of a company’s emissions based on country, industry and the scope.
Instead of the simple emissions-based intensity, calculated as the sum of total emissions intensity from Scope 1 and Scope 2, one can derive a cost-based intensity by considering the granular effective carbon prices of a company’s emissions based on country, industry and the scope.
Our analysis shows that this new cost-based intensity validates the investment thesis outlined at the beginning of this paper. Specifically, we devised two hypotheses, which we will now examine in greater detail, to test our investment thesis.
Hypothesis test 1: Given the investment thesis in which carbon pricing plays a crucial role, one must expect that the cost-based intensity (which considers the carbon costs) is a better predictor of earnings revisions at the stock level.
Using a fundamental prediction framework, we examine the predictive power of cost-based intensity on a company’s future earnings revisions multiple months ahead, controlling for past earnings revisions, emissions-based intensity, and other characteristics such as sector, region and country, using the joint Fama Macbeth regressions outlined below.

In Figure 7, we plot the multiple regression t-statistics4 for both the cost-based and emissions-based intensity. It is clear that controlling for the emissions-based intensity alpha signal (signs flipped to align the direction of investment, higher means lower intensity and greener companies), the cost-based intensity alpha signal has a statistically significant predictive power for more than one year ahead of future earnings revisions. Meanwhile, the raw emissions-based intensity alpha has no statistical significance, and slightly negative power in predicting future earnings revisions, in the presence of the cost-based intensity alpha.
Note, it is important that such a predictive relationship does not decay quickly, suggesting that stocks ranked highly according to the alpha signal anticipate analyst’s upward earnings revisions multiple months ahead. These results confirm the hypothesis and validate the logic in the investment thesis.
Figure 7. Predicting Future Earnings Revisions
Problems loading this infographic? - Please click here
Source: Man Numeric. T-stats are reported using Fama MacBeth Joint Multiple Regression with Newey-West Adjustment using quarterly observations. Regressions at each horizon are done without overlapping data.
Incorporating effective carbon price leads to better predictability in future earnings revisions and returns.
Hypothesis test 2: Given the better earnings revisions predictability, the cost-based intensity should improve the return predictability compared to emissions-based intensity.
Similar to the above, we examine the predictive power of cost-based intensity on stocks’ future quarterly returns multiple months ahead, controlling for emissions-based intensity and other characteristics such as sector, region and country, using the joint Fama Macbeth regressions.

Figure 8 plots the t-statistics of the return prediction of the multiple regression. Similar to the earnings revisions result, we see that cost-based intensity alpha remains statistically significant controlling for the raw emissions-based intensity alpha, and not vice-versa.
Figure 8. Predicting Future Quarterly Returns
Problems loading this infographic? - Please click here
Source: Man Numeric. T-stats are reported using Fama MacBeth Joint Multiple Regression with Newey-West Adjustment using quarterly observations. Regressions at each horizon are done without overlapping data.
Conclusion: Not all carbon emissions are equal, some are more costly than others
When utilising carbon intensity as an investment signal, it is crucial for investors to consider the intricacies of carbon pricing. By accounting for country, industry and scope-specific variations in carbon pricing, investors can more accurately assess the potential impact of carbon emissions on a company's financial performance and stock returns. Empirical evidence supports the logic applied in our investment thesis on carbon emission intensity when considering the costs. Incorporating effective carbon pricing into investment analyses provides a more comprehensive and nuanced understanding of the relationship between carbon emissions and investment outcomes.
Reproduction of any information, data or material, including ratings (“Content”) in any form is prohibited except with the prior written permission of the relevant party. Such party, its affiliates and suppliers (“Content Providers”) do not guarantee the accuracy, adequacy, completeness, timeliness or availability of any Content and are not responsible for any errors or omissions (negligent or otherwise), regardless of the cause, or for the results obtained from the use of such Content. In no event shall Content Providers be liable for any damages, costs, expenses, legal fees, or losses (including lost income or lost profit and opportunity costs) in connection with any use of the Content. A reference to a particular investment or security, a rating or any observation concerning an investment that is part of the Content is not a recommendation to buy, sell or hold such investment or security, does not address the suitability of an investment or security and should not be relied on as investment advice. Credit ratings are statements of opinions and are not statements of fact.
1. Venturini (2022). Climate change, risk factors and stock returns: A review of the literature. International Review of Financial Analysis, 79, 101934.
2. Refers to the GHG emissions that a company makes directly e.g., while running its boilers and vehicles. (Source: Deloitte).
3. Refers to the emissions a company makes indirectly e.g., the electricity or energy it buys for heating, which is being produced on its behalf. (Source: Deloitte).
4. T-statistics are used to determine if there is a statistically significant difference between the means of two variables.
You are now leaving Man Group’s website
You are leaving Man Group’s website and entering a third-party website that is not controlled, maintained, or monitored by Man Group. Man Group is not responsible for the content or availability of the third-party website. By leaving Man Group’s website, you will be subject to the third-party website’s terms, policies and/or notices, including those related to privacy and security, as applicable.