Introduction
Over the past 30 years, few parts of the capital markets have grown as quickly as leveraged finance. Following years of volatile lending conditions in the 1980s and 1990s, private-equity sponsors and their investment-banking colleagues realised they needed to develop a dedicated, capital markets solution to their acquisition-financing needs to reduce their dependence on commercial-bank and high-yield bond funding channels. In the mid-1990s, the first broadly syndicated loan (‘BSL’) securitisations were issued. 10 years later, on the precipice of the global financial crisis (‘GFC’), the Collateralised Loan Obligation (‘CLO’) market had emerged as a major channel for leveraged buyout (‘LBO’) finance.
The GFC, however, was a turning point. First, minimum capital requirements – especially for tangible equity capital – increased substantially. Second, for US banks and the US branches of foreign banks, capital charges were applied based on the credit risk of the borrower. For corporate loans, minimum capital charges for leveraged (B and BB rated) companies exploded (Figure 1).
Figure 1. Total Loss Absorbing Capacity (TLAC) Capital Charges Under Basel Rules
Problems loading this infographic? - Please click here
Source: Man GPM; as of 1 May 2023.
This increased capital burden destroyed bank competitiveness in leveraged markets.
Unsurprisingly, this increased capital burden destroyed bank competitiveness in leveraged markets. As an example, for a bank to generate the same return on capital from a single-B rated loan as from one rated BBB, it would need to earn roughly 6.5 times more spread income. Based on the levels prevalent at year-end 2022, that would have translated into pricing leveraged loans at a spread of 857 basis points; the market, however, was pricing single-B risk at 480 basis points (Figure 2).
Figure 2. Required and Market Spread
Problems loading this infographic? - Please click here
Source: Man GPM; as of 31 December 2022.
Banks that apply credit risk weightings based on credit ratings – which is to say, most large banks – cannot, in our view, compete with non-bank lenders unconstrained by such regulation. As such, over the past decade, credit-risky commercial lending has moved from the banking system into the capital markets (Figure 3).
Figure 3. Global CLO Market Size
Problems loading this infographic? - Please click here
Source: Man GPM and Barclays Research; as of 31 December 2022.
Following the GFC in 2008, increased minimum regulatory capital requirements drove regional banks out of the “middle market,” leaving non-bank, direct lenders to step in. By the end of 2020, managed assets at non-bank “direct” lenders was estimated by S&P to be $412 billion – up by 3,000% from $13.8 billion at the end of 2007.1
The Rise of Credit Risk Transfer
Unbeknownst to many investors, over roughly the same period, a smaller market had been growing almost as steadily. The market for credit risk transfer (‘CRT’) or regulatory capital transfer securitisations started in the 1980s, with JPMorgan distributing the senior tranches of an investment-grade corporate loan securitisation. The CRT market saw its first major development with the introduction of Basel II, allowing banks to distribute relatively thin, deeply subordinated securities as a risk-mitigation technique to help them reduce the risk weightings of loan portfolios substantially. Like the CLO market, CRTs performed exceedingly well through the crisis, with cumulative impairment rates through 2010 of just 0.8%.2
With hindsight, it’s clear why CLOs and CRTs performed so well during the crisis. First of all, the financial crisis was essentially about household indebtedness, housing prices and the resulting mortgage-loan risk to bank solvency. Non-financial corporate indebtedness was not particularly high, and in any case corporates – for the most part – were borrowing based on cash flows and not asset values. While corporate cash flows declined with the economic slowdown in 2008 and 2009, corporate interest expense declined even faster as interest rates were pushed to zero. As a result, default rates among leveraged loans fell quickly from their initial spike and remained lower than may have been expected through the following period (Figure 4).
Figure 4. 12-Month Leveraged Loan Default Rate
Problems loading this infographic? - Please click here
Source: Man GPM and Barclays Research; as of 31 December 2022.
Assets backing a CLO or CRT are simply left to mature, almost regardless of how long that takes.
In our view, however, the greater benefit to both CLOs and CRTs lay not in the quality of their obligors – but in their structure. CLO and CRT securitisations match fund assets and do not create artificial triggers or forced liquidations based on market values, which may otherwise force an unwinding of the reference portfolio, although both can have collateral quality tests that may result in de-levering over time. Assets backing a CLO or CRT are simply left to mature, almost regardless of how long that takes.
Similarities and Differences
Having now reviewed some of the features that we believe make the CLO and CRT market so robust, it’s worth considering what makes them distinct asset classes with relatively divergent collateral markets.
A CLO is a traditional cash securitisation whereby a pool of loans is transferred to a special purpose vehicle (‘SPV’) and tranched by priority of payment to create different rated securities with varying spreads. CLOs are largely backed by B/B+ rated loans issued to private-equity portfolio companies; as seen in Figure 3, the CLO market has more than doubled in size over the past decade and has become a significant source of capital for these companies. Additionally, CLOs are purchased by a wide investor base given the tranching and different credit ratings, from AAA to Equity.
Figure 5. Illustrative US Credit Tranches
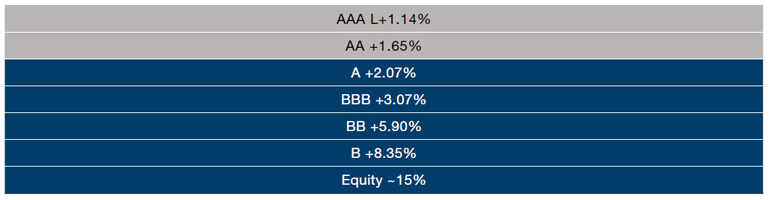
Source: Man GPM; as of 1 February 2023.
The CRT (now also called Significant Risk Transfer, or ‘SRT’) market, meanwhile, refers to a form of securitised credit risk sharing (‘CRS’) of bank-retained exposures. We examined CRS in more detail in our previous paper.
CRT interest payments are decided in advance of the issue of a deal and cannot be changed over the life of the transaction.
SRTs provide banks a solution to distribute investment-grade loan exposure and achieve regulatory capital relief while maintaining their critical commercial-lending relationships. Unlike CLOs, CRTs have no senior tranches to protect when asset performance deteriorates and therefore there are no cash-flow diversion tests. In fact, CRT interest payments are in no way linked to the cash flows of the underlying exposures. CRT interest payments are decided in advance of the issue of a deal and cannot be changed over the life of the transaction; this is an obligation of the issuing bank, sitting extremely high in their capital stack.
With this context, we highlight what we see as the 10 core differences between CLOs and CRTs:
1. Credit Quality
a. CLOs are backed by leveraged loans, which on average are rated single-B (Figure 6). Leveraged loans are funded loans with maturities generally between seven and 10 years, issued to private-equity-sponsored portfolio companies and other leveraged corporates running roughly 50-75% debt-to-capital ratios and greater than four times net-debt-to-EBITDA ratios, with implied default rates of 3-5% per annum (actual issuer default rates since 1998: 2.9%) and expected recoveries of 50% (actual average recovery since 1990: 66%).3
Figure 6. Distribution of CLO Holdings by Rating, 2014-2022 Average
Problems loading this infographic? - Please click here
Source: Man GPM and Barclays Research; as of 31 December 2022.
b. SRTs typically reference loans or exposures to corporates with an average credit rating of BBB-, debt to capital of 5-30% and net debt to EBITDA of 0.5-3.0 times; lower debt capitalisation leads to expected default rates of <1.0% and recoveries of >80%.4 Compared with relatively homogeneous CLOs, considerably greater product (revolvers, term loans, receivable financing) and borrower (inclusive of small and medium-sized enterprises, there are millions of potential reference obligors) heterogeneity are available from SRT transactions.
Figure 7. Distribution of SRT Exposure by Rating
Problems loading this infographic? - Please click here
Source: Man GPM; as of 1 February 2023.
2. Cash Flow versus Synthetic
a. CLOs are cash securitisations that transfer loans (or in the case of a participation, loan cash flows) from an originator to an SPV.
b. SRTs are synthetic securitisations which only reference underlying exposures. In the case of sponsor failure, SRT investors have no recourse to the underlying loans but, if a coupon payment is missed, the bank is in default and the transaction unwinds.
3. Capital Structure
a. CLOs issue multiple tranches rated single-B to AAA in addition to an equity tranche. CLOs, like all cash securitisations, are primarily driven by the need to reduce the total cost of funds in order to maximise equity returns (otherwise known as “the arbitrage”).
b. SRT securitisations typically result in only a single unrated tranche issued to investors. The rest of the portfolio is retained by the sponsor. Without an issued senior tranche, SRTs are not structured to protect ratings and so the SRT tranche is never exposed to cash-flow diversion or rapid senior amortisation.
Figure 8. Illustrative SRT & CLO Tranche Comparison by Rating
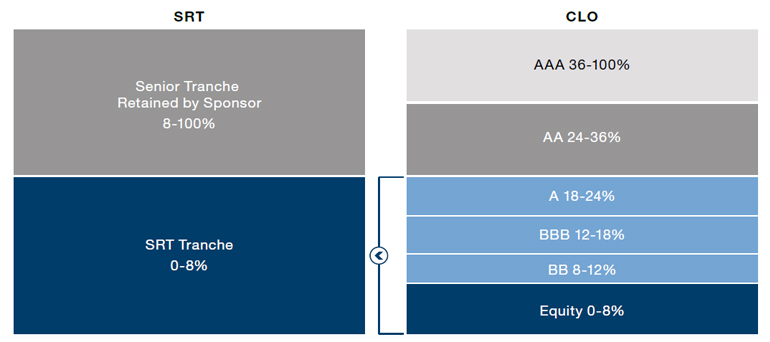
Source: Man GPM; as of 1 February 2023.
4. Cash Flow Waterfall
a. CLO equity investors are last in line to receive loan cash flows. As loans default, cash-interest income declines while interest expense remains unchanged. This means that residual income – interest income less interest expense – declines. As and when certain portfolio tests fail, senior tranches are often paid preferentially, often stopping all cash flows to subordinated investors. That noted, CLO managers often reset CLOs once residual income declines.
b. SRT investors are paid a fixed spread on remaining principal throughout the life of the transaction. Regardless of changes to the portfolio, since there are no senior investors to protect, cash flows to the subordinated tranche are never turned off.
5. Leverage
a. CLO equity is typically 8-10% of a portfolio of loans geared four to five times, creating gearing to underlying corporate cash earnings of roughly 50 times.
Figure 9. New Issue Leverage, Three-Month Average
Problems loading this infographic? - Please click here
Source: Man GPM and Barclays Research; as of 31 December 2022.
b. SRT tranches are typically 7-8% on portfolios of loans leveraged two to three times, generating roughly 25-35 times leverage to cash earnings, depending on the credit quality of the reference portfolio.
6. Recoveries
a. Leveraged loans have over the past 30 years recovered, on average, 66% of the amount of the initial loan balance, with recoveries sensitive to security value and loan structure.5
b. SRT exposures typically recover around 80% of the initial exposure balance, benefitting from relatively large amounts of subordination in the capital structures of referenced obligors.6
7. Returns
a. CLO equity internal rates of return (‘IRR’) have oscillated around 10-20% over the past two decades.7 Of course, some deals have generated higher returns and a small number have even lost money. CLO equity returns are sensitive to cumulative default rates and the timing of default rates as well as recoveries.
b. SRT returns have tended to cluster around 8-12% over the past decade.8 SRT returns, however, are not directly comparable to CLO equity returns and we believe they should be compared with a subordinated (BBB-rated and below) unitranche CLO position. Unsurprisingly, buying all of the subordinated layers of a CLO produces lower returns than just buying CLO equity; such a strategy would typically return 7-8% per annum.9
8. Funding
a. CLO assets are match-funded with long-term liabilities. That noted, leveraged borrowers are exposed to refinance risk since CLOs are not permanent funding vehicles.
b. SRTs assets are funded by the bank sponsor. Banks are typically expected to have liquidity under all circumstances, up to and including when in receivership. That noted, bank deposit and wholesale funding runs can substantially impair a bank’s ability to fund loan refinancings. As such, bank and banking system risk is an important component of SRT risk analysis.
9. Diversification
a. The CLO market is comprised of large (syndicated) and middle-market corporate leveraged loans. While virtually every industry is represented, issuers are concentrated in the United States where about 75% of the borrowers are based.10
b. The SRT market is comprised of hundreds of thousands of obligors in every industry across most of the world’s major economies.11
10. Liquidity
a. CLO securities are largely liquid instruments that can be sold in the over-thecounter markets. As CLOs are typically marked to market more frequently, they may also be more sensitive to credit-spread movements.
b. SRT securities are largely considered private and typically do not trade in the secondary market.
Conclusion
Both CLOs and SRTs are, in our view, defined by exceedingly robust structural features.
Just as the CLO market provides much-needed funding to the leveraged buyout market, SRTs provide capital to support lending to markets that can only be served efficiently by the banking system. Both CLOs and SRTs are, in our view, defined by exceedingly robust structural features that allow assets the time and space to perform in their respective markets.
1. Source: S&P Global; as of 12 October 2021.
2. Source: Moody’s Investors Service, Default & Loss Rates of Structured Finance Securities: 1993-2010.
3. Source: Man GPM, Barclays and JPMorgan; as of 1 February 2023.
4. Source: Man GPM; as of 1 February 2023.
5. Source: Man GPM and JP Morgan Default Monitor; as of 1 February 2023.
6. Source: Man GPM; as of 1 February 2023.
7. Source: Man GPM; as of 1 February 2023.
8. Source: Man GPM; as of 1 February 2023.
9. Source: Man GPM; as of 1 February 2023.
10. Source: Man GPM; as of 1 February 2023.
11. Source: Man GPM; as of 1 February 2023.
You are now leaving Man Group’s website
You are leaving Man Group’s website and entering a third-party website that is not controlled, maintained, or monitored by Man Group. Man Group is not responsible for the content or availability of the third-party website. By leaving Man Group’s website, you will be subject to the third-party website’s terms, policies and/or notices, including those related to privacy and security, as applicable.