Introduction
We believe investors need to incorporate climate-change exposures into the investment decision-making process.
We present an asset-pricing anomaly around climate-change risks with respect to the semi-strong form of the efficient-market hypothesis under classical empirical asset-pricing models. We find that:
1. Investors on average underreact to public information on climate-change risks. Stocks positively exposed to the attention to climate change in the past (“green” stocks) outperform relative to stocks negatively exposed (“brown” stocks) by 5.9% per annum (t-stat 4.45), which cannot be explained by a collection of well-known asset-pricing factors, separately or jointly.
2. The degree of outperformance is empirically associated with investor attention to climate-change risks. However, "green" stocks still outperform "brown" stocks even when the attention is low.
Both findings challenge the risk-return trade-off implied by the existing classical asset-pricing models. We believe investors need to incorporate climate-change exposures into the investment decision-making process.
Attention to Climate Change Is Measurable
Although unobservable, global attention to climate change is real. We know this because three independent measures of such attention share a common component that is time-varying and driven by major global events relevant to climate change.
In Figure 1, we plot these three independent measures of global attention to climate change: 1) a simple Google Trend measure, 2) an NLP topic model based measure, and 3) the Climate News Index, a model-free headline count measure. It is apparent that all three measures share a synchronous pattern that reacts around major global events. When looking at the growth rates, we find that they share a 75% to 86% correlation with each other (Figure 2).
For our analysis, we use the Climate News Index calculated using RavenPack news headline data, because it does not have data-induced or model-induced look-ahead bias. The Climate News Index is calculated by counting the fraction of climate-related headlines out of all business articles in the rolling past 12 months, where climate-related headlines are defined as containing the following five key phrases: Climate Change, Global Warming, Greenhouse Gas, Carbon Emissions, IPCC.
Figure 1. Independent Measures of Attention to Climate Change
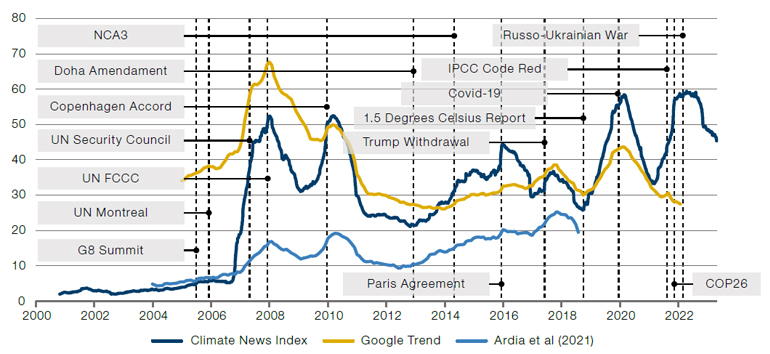
Figure 2. Correlations between Independent Measures of Attention to Climate Change
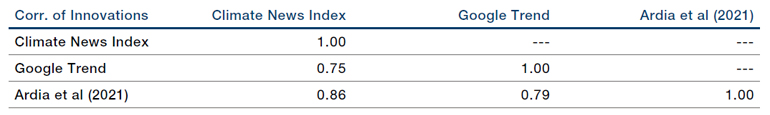
Source: Man Group; Google Trend; Ardia, Bluteau, Boudt & Inghelbrecht (2021); RavenPack; as of 26 April 2023.
Identifying Climate Change Exposed Stocks
We estimate the stock-level time-series sensitivity to innovations in the Climate News Index, using residual returns with a lookback of five years.

To reduce estimation noise, we focus on the residual returns which remove impacts from market and known factors and then apply Bayesian shrinkage to the estimated beta towards the industry median.
We find that the resulting betas make intuitive sense: for example, Energy stocks generally have lower exposures while Renewable Utilities have higher exposures.
If we look at several metrics of the “greenness” of the positively exposed and negatively exposed stocks in Figure 3, we find that stocks positively exposed to the Climate News Index are generally greener than those negatively exposed.
Figure 3. Weighted “Greenness” Metrics of Stocks Positively and Negatively Exposed to the Climate News Index
Problems loading this infographic? - Please click here
Source: Man Group; as of 31 December 2022.
Exposure to Climate News Index is Persistent
Examining the estimated exposures, we find that historically estimated exposure delivers ex-post future exposure to the Climate News Index. In Figure 4, we sort stocks into five buckets based on estimated betas five years ago to avoid overlapping data and look at the average realised beta. We see a monotonic relationship between ex-ante beta and ex-post beta. This suggests that stocks that historically are positively (negatively) exposed to changes in the Climate News Index are likely to continue to be positively (negatively) exposed.
Figure 4. Average Realised Ex-Post Exposure by Ex-Ante Quintiles
Problems loading this infographic? - Please click here
Source: Man Group; as of 31 December 2022. Time period: 1 January 2008 to 31 December 2022. Universe: US top 3,500 stocks by market capitalisation.
The Climate News Anomaly Is a Challenge to Existing Asset Pricing Models
We form a long/short portfolio based on these estimated betas and find that this simple strategy delivers a sizable and statistically significant 5.9% annual compounded excess return with a t-stat of 4.45.
If the market is semi-strong form efficient with respect to a given asset-pricing model, such a portfolio should not deliver significant alpha (excess returns that cannot be explained by known asset-pricing factors). However, we see that across 10 factors that we tested, separately or jointly, the significant alpha remains.
The climate-news anomaly cannot be explained by existing asset-pricing factors.
Figure 5 presents coefficients and t-stats of the various asset-pricing tests’ specifications, using monthly return series. Tested separately or jointly, the alpha of the long/short portfolio remains statistically significant, adjusted for Newey-West standard errors. This implies the climate-news anomaly cannot be explained by existing asset-pricing factors, hence challenges the semi-strong form of the efficient-market hypothesis with respect to the existing asset-pricing models.
Figure 5. Coefficients and T-Stats by Asset-Pricing Models
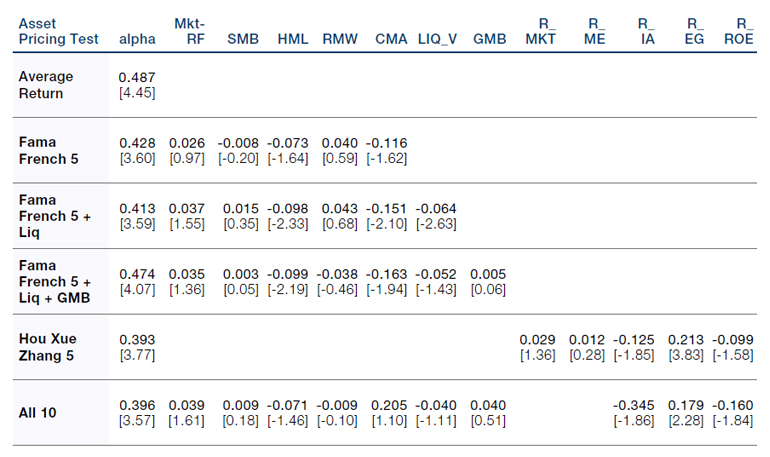
Source: Man Group; as of 31 December 2022. Numbers in brackets are Newey-West T-stats. Time period: 1 January 2008 to 31 December 2022. Universe: US top 3,500 stocks by market capitalisation. Long/short portfolio returns ignore transaction costs. Mkt-RF, SMB, HML, RMW, and CMA are the Fama-French (2015) market, size, value, profitability, and investment factors. LIQ_V is the Pastor Stambaugh (2003) liquidity factor. GMB is the green-minus-brown factor of Pastor et al (2022). R_MKT, R_ME, R_IA, R_EG, R_ROE are the Hou Xue Zhang (2020) market, size, investment-to-asset, expected growth, and profitability factors. Please see the important information linked at the end of this document for additional information on hypothetical results.
The Climate News Anomaly Is Empirically Associated with Investor Attention
The theoretical underpinning of the return spreads between “green” and “brown” stocks are an ongoing debate in academic literature (see Venturini 2022 for a review). In our view, there are two main competing economic rationale for climate-change risks and stock returns:
a) Risk premium: Market is efficient, and the return differences are due to risk exposures receiving compensations or discounts.
b) Behavioural bias: Return spreads between “green” and “brown” are mispricing due to investor behavior.
In the risk premium rationale, “green” stocks (climate-change favoured stocks) should have lower expected returns than “brown” because they provide a hedge against climate risks (Pastor et al, 2021). In other words, for investors to be willing to hold a “brown” company in an efficient market, the expected return needs to be higher to compensate for the occasional unexpected pressure during intensified climate change attention periods. This implies that during the periods when climate change attention is low, “brown” stocks must be expected by the market to outperform “green” stocks.
Meanwhile, the behavioural bias rationale would postulate that the market generally overlooks the ramifications of climate change news, which leads to over-valuation of “brown” stocks relative to their respective true valuations - and vice versa, the under-valuation of "green" stocks. While we do anticipate underperformance of “brown” stocks relative to their “green” peers during periods of intense climate change attention, similar to the ‘risk premium’ argument, the key difference is that we do not expect a strong outperformance of “brown” stocks outside of such intense attention episodes under the behavioural bias rationale.
Our evidence seems to be at odds with the risk premium rationale, and more consistent with the behavioral bias rationale. First, as illustrated before, climate-change favoured stocks (“green” stocks) significantly outperform “brown” stocks. Second, we find “brown” stocks do not outperform “green” stocks when climate change attention is low. To see this, we split the sample into two separate regimes based on the intensity of attention to climate change determined by our Climate News Index: periods when climate attention was high (Climate News Index increasing), and when it was low (Climate News Index decreasing) (Figure 6). We find that the long/ short portfolio’s return does ride the increasing trend when climate attention intensifies as expected by both hypotheses. However, “brown” companies are not compensated enough in low attention periods. In fact, “green” companies still tend to outperform their “brown” counterparts during low climate change attention periods, albeit by a smaller margin compared to periods of high attention. Similar results are observed if we split the sample in a different way, based on unexpected innovations of Climate News Index.
This finding lends further support to our belief that the excess return is not simply a compensation to some potentially costly risk exposure, but rather an alpha opportunity as the market slowly adjusts its interpretation of climate change news.
Figure 6. Climate News Index, Regimes and Events
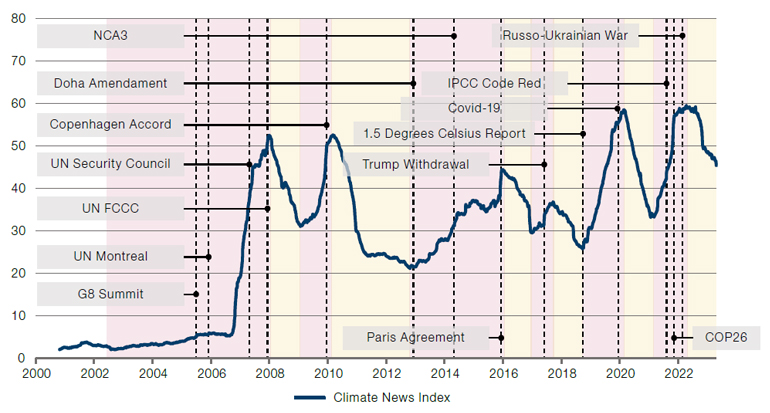
Source: Man Group; as of 10 May 2023. Periods when climate concerns were increasing/decreasing are shaded red/yellow.
Figure 7. Average Long/Short Portfolio Returns by Climate News Regimes, Across Regions
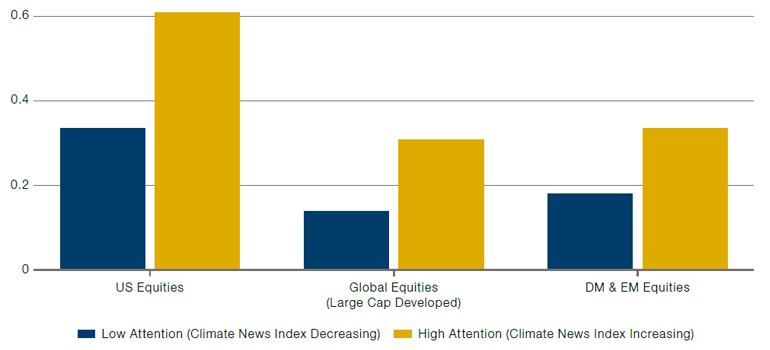
Source: Man Group; as of 31 December 2022. Time period: 1 January 2008 to 31 December 2022. Universe: US top 3,500 stocks by market capitalisation; Global Equities top 5,000 developed-market stocks by market capitalisation; DM Equities top 8,000 developed-market stocks by market capitalisation; EM equities top 5,000 emerging-market stocks by market capitalisation. Long/short portfolio returns ignore transaction costs. Please see the important information linked at the end of this document for additional information on hypothetical results.
Conclusion
Our evidence is consistent with the behavioral bias rationale. In fact, the continued doubts of the pecuniary benefits of climate-change investing itself may potentially exacerbate the market inefficiency.
This paper contributes to the ongoing debate around market efficiency regarding climate changes.
If the market is efficient, and if climate-change risks are fully priced by a given asset-pricing model, “green” or “brown” stocks should not receive excess risk-adjusted returns. Our paper finds empirical evidence that rejects this joint hypothesis. We find “green” stocks deliver significant, higher risk-adjusted returns than “brown” stocks that cannot be explained by well recognised asset-pricing models.
Our evidence is consistent with the behavioral bias rationale. In fact, the continued doubts of the pecuniary benefits of climate-change investing itself may potentially exacerbate the market inefficiency. By demonstrating an alpha-harvesting strategy to take advantage of such market inefficiency, we believe this paper offers a justification for climate investing as not only a “do good”, but also a “do well” proposition.
References:
Ardia, Bluteau, Boudt & Inghelbrecht (2021), Climate Change Concerns and the Performance of Green Versus Brown Stocks, SSRN, https://papers.ssrn.com/sol3/ papers.cfm?abstract_id=3717722
Fama, French (2015), A five-factor asset pricing model, Journal of Financial Economics, 116 (2015) 1-22
Hirshleifer and Teoh (2003), Limited attention, information disclosure, and financial reporting, Journal of Accounting and Economics, Volume 36, Issues 1-3, December 2003, Pages 337-386
Pastor, Stambaugh (2003), Liquidity Risk and Expected Stock Returns, Journal of Political Economy, vol 111, No.3, pp. 642-685
Pastor, Stambaugh, Taylor (2022), Dissecting green returns. Journal of Financial Economics, vol 146, No 2, pp.403-424
Venturini (2022). Climate change, risk factors and stock returns: A review of the literature. International Review of Financial Analysis, 79, 101934.
Pastor, Stambaugh, Taylor (2021). Sustainable investing in equilibrium. Journal of Financial Economics, 142(2), 550-571.
You are now leaving Man Group’s website
You are leaving Man Group’s website and entering a third-party website that is not controlled, maintained, or monitored by Man Group. Man Group is not responsible for the content or availability of the third-party website. By leaving Man Group’s website, you will be subject to the third-party website’s terms, policies and/or notices, including those related to privacy and security, as applicable.