With contribution from Robert E. Furdak and Jason Mitchell
Introduction
Incorporating environmental, social and governance (‘ESG’) analysis has been the natural habitat for sovereign bond investors for decades – especially as it pertains to governance. What is new is that ESG data have matured over the last decade, and we are entering a phase where the data have both a long-enough history and broad-enough coverage to make it interesting to quantitative investment firms.
At Man Group, we have been able to demonstrate alpha from ESG factors in systematic security selection for equities. Can the same be said for sovereign bond selection? After all, ESG analysis – particularly the ‘E’ & ‘S’ components – have become increasingly important in forming long-term growth, inflation and monetary policy outlooks, all of which are important factors investors look at for sovereign bond selection.
For the reader in a hurry: we have not been able to find systematic alpha in ESG data for sovereigns so far. However, for a discretionary fund manager, we believe ESG data analysis is a potential rich area for idiosyncratic alpha.
The Link Between ESG Data and Discretionary Analysis for Sovereigns
The alignment of investment returns and long-term sustainability objectives has been the subject of many finance researchers for several years, not least at Man Group.1
There exists a very high level of agreement across two well-known ESG data vendors in both governance and social data for sovereign bonds. What is interesting, though, is that there is very little agreement at the environmental level.
Naturally, good – or improving – ESG factors can help the investment process, and gauge the solidity of the tax base for a sovereign issuer, and the sustainability of government finances as it relates to E, S and G. The reverse also applies: taken to the extreme, it is unprofitable to invest in a security issued by an organisation that goes bankrupt due to bad management and/or running the business or country in an unsustainable way.
We believe it is worth looking at the correlations of the E, S and G scores across vendors to determine if there are any areas of data confusion that can provide idiosyncratic alpha.
As Figure 1 illustrates, there exists a very high level of agreement across two well-known ESG data vendors in both governance and social data for sovereign bonds. This suggests to us that the data is well known, not subject to much debate, and thus potentially lacking alpha. The ‘G’ element in particular, which makes up at least 50% of both MSCI and Sustainalytics total score, should be public knowledge, with data sources like the World Bank which has published the excellent World Governance Indicator (‘WGI’) report bi-annually since 1996. Of course, outliers exist: South Africa, for example, is ranked 83rd by Sustainalytics in the governance factor versus 44th at MSCI. However, in general, there is agreement between vendors for the ‘S’ and ‘G’ elements.
What is interesting, though, is that there is very little agreement at the ‘E’ level.
Figure 1. MSCI, Sustainalytics Agree on 'S' and 'G' Data for Sovereign Bonds; Less So for ‘E’
Source: MSCI, Sustainalytics; as of 21 March 2022.
The pronounced disagreement on ‘E’ scores is worth analysing. At a headline level, differences are already obvious, with MSCI defining ‘E’ simply as environment, whereas Sustainalytics uses a broader ‘natural and produced capital’ category. Under this heading, Sustainalytics considers ‘corruption’ and ‘rule of law’ as ‘E’ – rather than the more traditional classification under ‘G’.
More detailed analysis reveals more subtle differences in the construction of the ‘E’ scores, whereas the frameworks surrounding ‘S’ and ‘G’ are strikingly similar. For example, MSCI focuses on environmental externalities, whereas Sustainalytics more directly considers factors like carbon intensity. This direct versus indirect approach appears throughout the analysis framework, with another example of Sustainalytics using ‘land below 5 metres’ to represent sensitivity to a changing climate, whereas MSCI less prominently adds ‘vulnerability to environmental events’ as a general category.
So, using aggregate scores could point to limited alpha potential if only using aggregate ESG scores. However, there is more scope for alpha when considering ‘E’, ‘S’ and ‘G’ scores and the various components separately.
Overall, though, there is a positive correlation between credit ratings and ESG scores2 (Figure 2), which implies that: (1) ESG data has analytical value for sovereign default probability; and that (2) this value is already priced in, to some degree.
Figure 2. Credit Ratings Are Positively Correlated to ESG Scores
Source: Bloomberg, Sustainalytics; as of 21 March 2022.
Note: Credit ratings range from 1 for AAA to 19 for CCC3; the lower the Sustainalytics ESG score, the better.
That is not the same as saying that ESG data are not additive – it is quite possible that ESG data are additive after a quantitative transformation that removes the fundamental data content that is captured in price data. This could, for instance, be done through regressions.
ESG analysis for a discretionary fund manager can be additive to sovereign debt selection in at least three ways.
Researchers at Barclays3 have done such an exercise, and found no evidence of alpha in systematic selection of sovereign bonds using ESG data, even after regressing out fundamental factors such as credit ratings. However, they did conclude that the ESG score of a portfolio of sovereign bonds could be optimised without sacrificing return beta, or generating negative alpha, which may imply the ability to improve risk-adjusted returns by lowering the likelihood of experiencing future negative shocks through ESG data.
Overall, we believe ESG analysis for a discretionary fund manager can be additive to sovereign debt selection in at least three ways:
- A discretionary fund manager can disaggregate, dissect and analyse the data in order to reach a conclusion that disagrees with the consensus;
- While aggregate ESG scores agree across data providers, there is more debate and disagreement at more granular levels of data – especially for the E pillar – hence potentially more scope for alpha. For example, detailed environmental risk data can help identify the likelihood of negative shocks such as natural disaster-related incidents. Social and governance scores could estimate the effectiveness of any likely response to such shocks. The ability to avoid the impacts of negative shocks could improve risk-adjusted returns;
- Importantly, increased investor engagement, net fund inflows and regulatory changes may benefit investments with better ESG scores in the future.
Systematic Alpha in ESG Data for Sovereigns
In our article ‘ESG Data: Building a Solid Foundation’, we demonstrated that there was alpha to be found from ESG factors in systematic security selection for equities: Figure 3 shows how a blend of our proprietary E, S and G factors provides a higher information ratio than either Sustainalytics or MSCI. For example, we find that ESG scores correlate positively with Quality, which can be used as an alpha signal.
Figure 3. Man Numeric’s ESG Blend Has a Higher Information Ratio Than Sustainalytics or MSCI
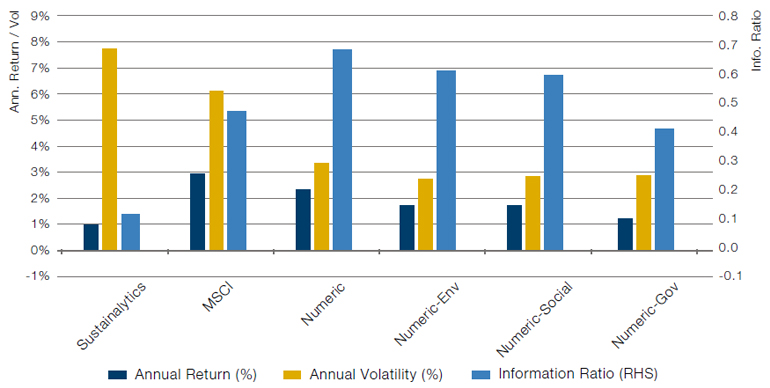
Source: Man Numeric; as of 31 December 2021.
Performance of broad-based ESG blend. Numeric ESG Model maps vendor data to 14 principles-based pillars. Results are based on monthly rebalanced decile portfolios pre transaction costs.
Please see the important information linked at the end of this document for additional information on hypothetical results.
Is there an alpha signal in ESG data for systematic selection of sovereign debt issuers too?
Before embarking on a quantitative quest, we have some thoughts on this from the outset.
First, positive ESG scores can be an indication of a corporate or country’s ability to grow in a stable and sustainable way. While an equity investor can benefit from profitable growth, this may be less relevant for debt securities. A large part of successful debt investing is more about accurately identifying the probability of default than the market, i.e., selecting between sovereigns that pay their coupons and return the principal at maturity versus those that are likely to become distressed.
In our analysis, we were not able to find systematic alpha in ESG data for sovereigns – at least not yet.
Second, we would posit that historically, there has not been alpha in ESG data as it pertains to developed market sovereigns with strong ESG characteristics, especially if the data confirm common knowledge. Recently, however, this pattern may have changed as environmental data is increasingly being used to drive fiscal4 and monetary policies.5 There could, of course, be alpha in weak ESG data for sovereigns, to the extent that ESG factors could lead to negative shocks such as natural disaster incidents that a country is ill-prepared for, necessitating large fiscal outlays that could undermine the ability to pay coupons or principal.
Third, a backtest of historical ESG data may well be a poor guide to the future, as environmental and social considerations were not perceived to be as acute or important as they are now in the eyes of citizens, governments and investors.
In our analysis, we were not able to find systematic alpha in ESG data for sovereigns – at least not yet. This could be due to the following reasons:
- First, contrary to ESG data for equities, where there is much disagreement between data providers, ESG data for sovereigns agree with each other at the aggregate level – as well as for S and G factors. This suggests there is little controversy and debate, especially for developed-market (‘DM’) sovereign issuers. Low controversy implies low alpha content;
- Second, we find there is a high correlation between ESG data and fundamental factors such as credit ratings. This is possibly a function of the large influence of the ‘G’ component in ESG scores, which has long been part of sovereign bond analysis;
- Third, environmental and social constraints on global production have been less significant in the past, when they were non-binding and less dominant, while macro factors dominated. Thus, a test of historical ESG data is not likely to show as much relevance as one might expect going forward. Increases in pollution, population and climate events have resulted in more economic sensitivity to environmental and social factors.
ESG Scores and the Benefit of Discretionary Analysis
Can specific ESG datapoints of individual countries be misleading, or be of such significance, that their impact on headline ESG scores significantly under- or overestimates their potential economic impact? Our analysis shows that the answer to these questions is ‘yes’, and as such, alpha within ESG data may be unearthed through detailed individual analysis, rather than systematic analysis of scores.
To illustrate, we pick three countries: Australia, Italy and Brazil. All of these countries share two important characteristics: (1) they have well-developed and readily investible government bond markets; and (2) they face unique and significant environmental and social challenges.
For each, we consider headline ESG scores shown in Figure 4. We also highlight key ESG factors that might be important beyond the scope of merely their impact into ESG scores.
Figure 4. Headline ESG Scores – Australia, Italy, Brazil
Source: Sustainalytics, WGI; as of 21 March 2022.
Note: A high score is good, except in the case of the aggregate score, when the lower the score, the better. ** Range -2.5 (weak) to 2.5 (strong).
Can specific ESG datapoints of individual countries be misleading, or be of such significance, that their impact on headline ESG scores significantly under- or overestimates their potential economic impact? Our analysis shows that the answer to these questions is ‘yes’.
Australia generally performs excellently in key areas of ‘habitat protection’, ‘control of corruption’ and ‘rule of law’. It is the highest-scoring developed country in environmental wealth in the Sustainalytics universe. However, Australia does not appear to be stewarding all its environmental wealth responsibly. The country has no carbon tax and a poor carbon intensity score showing short-term economic gains are perhaps being prioritised, which are not necessarily sustainable. Australia also scores poorly in ‘water productivity’, which is worrying given that the only continent that gets less rainfall than Australia is Antarctica!
Analysing Italian debt involves a confluence of strong signals – some positive, some negative. Italy is the most indebted of our three examples, having managed to accrue government debt equal to over 140% of GDP.6 Uniquely, for a country this indebted and with a relative low market-assigned default risk, it scores poorly in governance. Excess indebtedness and poor governance were both key factors that drove Italian 10-year yields to record highs 2011/12 and threatened the viability of the entire Eurozone, the world’s largest currency and trading block. However, Italy benefits from the governance credibility and financial strength of its euro-area neighbours through shared institutions, specifically the European Central Bank, making its standalone governance score of 60.4 somewhat misleading to a sovereign bond investor. Italy also has a large amount of financial and social wealth, visible in indicators such as ‘life expectancy at birth’ and ‘physicians per 1,000 people’. A key environmental risk faced by Italy, which may not be appreciated by many market participants, is the extent of ‘land below 5 meters’, which will have meaningful macroeconomic effects through ongoing insurance costs (and thus decreased consumption) and vulnerability to a changing/warming climate.
As the only emerging market in our comparison, Brazil is going to face a high bar in this analysis. With the Amazon rainforest residing within its borders, Brazil has an outsized global environmental responsibility. It must balance short-term economic gains from deforestation with the possibility of longer-term global income payments for environment protection, a clear example of how increased global focus on ESG can benefit the entire population. Recognition of, and compensation for, effective stewardship of this globally important environment can change the incentives around deforestation in Brazil to the benefit of all. Elsewhere, Brazil scores very well in its ‘gender development index’. Its score here is actually higher than the developedmarket average (62 versus 59), making it a potential hidden source of economic strength as it can deploy its human capital much more effectively than the average emerging-market economy. Brazil’s high current unemployment rate however remains a barrier to it using this strength optimally.
Conclusion
We have not yet found strong evidence that there is alpha in using headline ESG data for sovereign security selection in a systematic way.
However, an ESG approach to sovereign debt selection can be additive in at least three ways: first, a discretionary fund manager can disagree with the data and the consensus, due to the edge the fund manager and their process provide; second, while aggregate ESG scores are in agreement across data providers, there is more debate and disagreement at more granular levels of data, hence potentially more scope for alpha; and third, flows and regulatory developments are likely to benefit investments with better ESG scores in the future.
1. See, for instance: “ESG and Man Group’s Multi-Asset Offering”, 1 Oct 2019;
www.man.com/maninstitute/covid19-interrupt-esg-trend ; and Man DNA Quarterly Commentary, “Applying our ESG Principles in Multi-Asset funds”, 1 October 2020.
2. As determined by Sustainalytics.
3. Source: Barclays; Performance of ESG-Tilted Portfolios of Sovereign Bonds; 26 January 2022.
4. Lai, Olivia; “What Countries Have a Carbon Tax”; Earth Org; 10 September 2019,
earth.org/what-countries-have-a-carbon-tax
5. Brunetti, Celso., et al; “Climate Change and Financial Stability”; Federal Reserve; 19 March 2021; www.federalreserve.gov/econres/notes/feds-notes/climate-change-and-financial-stability-20210319.htm
6. Source: IMF, WEO; as of October 2021.

You are now leaving Man Group’s website
You are leaving Man Group’s website and entering a third-party website that is not controlled, maintained, or monitored by Man Group. Man Group is not responsible for the content or availability of the third-party website. By leaving Man Group’s website, you will be subject to the third-party website’s terms, policies and/or notices, including those related to privacy and security, as applicable.