Overview
- We study time-series momentum (trend-following) strategies in bonds, commodities, currencies and equity indices between 1960 and 2015
- Our key observations are that:
- Momentum strategies performed consistently well both before 1985 (bond bear market) and after 1985 (bond bull market)
- Trend-following returns are positively skewed, especially for shorter-term (faster) momentum strategies
- There are some similarities between trend following and a long straddle (put option plus call option) strategy
- Strategy performance is best in the worst equity and worst bond environments
- Restricting the momentum strategy from being long equities or bonds enhances performance in crisis periods, but reduces the average return and reduces the protection in the other asset class
- Our conclusions directly contradict the beliefs of some investors that trend following only protects against equity market sell-offs
- We also disprove the assertion that trend following has only been successful due to the 30 year rally in fixed income markets
Introduction
Over the last few years we have seen futures trend following being used as a tool for institutional investors looking for “crisis alpha”.1 For investors this means a strategy that has the potential to deliver outperformance during (typically equity) market stress periods. In this paper we address three questions:
- First, should we expect futures trend following to be profitable in an environment where government bond yields rise?
- Second, are the protection characteristics of trend following confined to equities, or do they work in government bonds as well?
- Third, is it possible to improve the protection characteristics of a futures momentum strategy by removing the ability to be long equities or bonds?
Backdrop
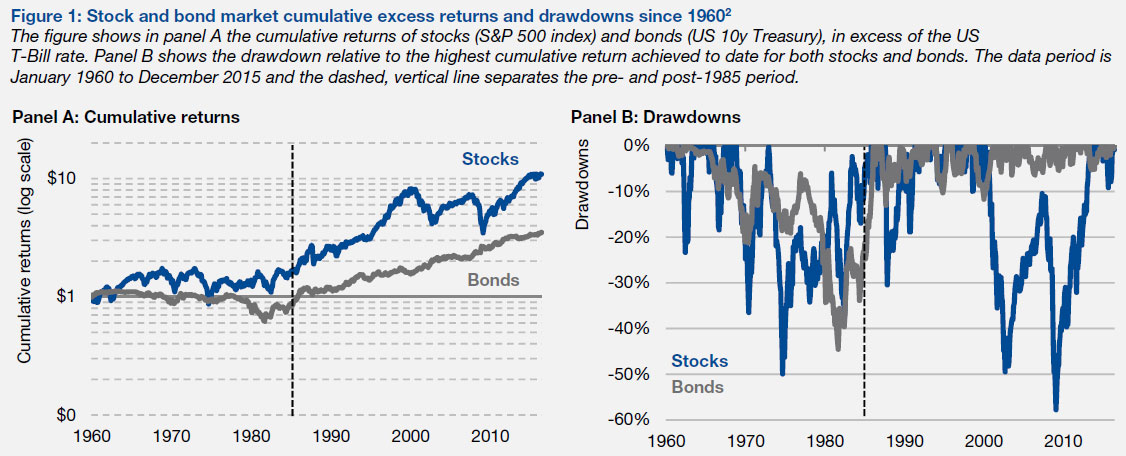
Government bonds have experienced an extended bull market since 1985. This is illustrated in panel A of Figure 1, where we plot the cumulative excess return of US 10-year Treasuries (grey line) and the US S&P 500 index (blue line), relative to the US T-bill rate. This shows a near straight line up for bonds since 1985. Panel B of Figure 1 plots the drawdown level, which rarely exceeded 10% for bonds in the post-1985 period. A trend following strategy may have benefitted from the consistent upward trend after 1985 by holding a (predominantly) long bonds position.
The strong bond performance was driven by significant rates compression. US yields fell from almost 16% in the early 1980s, to below 2% as at March 2016. Many economists believe yields cannot fall much further, even though slightly negative yields are possible, as we have seen recently in several developed markets. So it is natural to ask if trend-following strategies can maintain performance in the absence of a bond market tailwind, and indeed if they can protect against stress in bond markets of the form seen in the 1960s, 70s and early 80s.
Outline
In this paper we seek to shed light on these questions by studying trend-following strategies from 1960 onwards. Importantly, this includes the pre-1985 period, which shows a starkly different picture compared to post-1985. Over the 1960-1985 period bonds experienced negative excess returns on average, while stock markets provided modest positive average excess returns and quite frequent drawdowns (Figure 1).
We start by discussing the data available to us in Section 1, followed by the definition of a straightforward momentum strategy in Section 2. Extending our analysis back to 1960 requires us to use monthly data and augment the available history of futures and forward returns with proxies based on cash returns, financed at the local short-term rate.
In Section 3, we show that strategies based on the past four months’ returns (lag 1 to 4) experienced consistently strong performance, as do strategies based on returns of almost a full year ago (lag 9 to 11). However, strategies based on returns at the intermediate horizon (lag 5 to 8) underperformed consistently, over time and across asset classes. Next, we form a strategy that (within our framework) best explains the representative BTOP50 managed futures index (which we refer to as “momCTA”) and find that this replicating strategy puts almost all weight on lags 1 to 4, thus largely ignoring the predictability of lags 9 to 11.
Next, we show that momCTA inherits two important risk characteristics that are particularly associated with momentum strategies based on recent returns. First, in Section 4, we show that momCTA has positively skewed returns, in particular when returns are evaluated over multiple months (we specifically consider 3 and 12-month evaluation windows). We argue this result is intuitive and related to the property of adding to winners and cutting losers, which is similar to the dynamic replication of a long option straddle position.
Then, in Section 5, we show that momCTA performed particularly well in the worst equity and bond market environments, giving credence to a claim that trend-following offers the potential for equity and bond crisis alpha. This is illustrated in Figure 2, which shows the average annualized momCTA return for rolling 3-month windows for different equity (panel A) and bond (panel B) market return quintiles. Performance was not only strong in the worst, but also in the best equity and bond market environments, revealing a well-known “equity smile” and a lesser-known, but even more pronounced “bond smile”.
We find that the equity and bond crisis alpha was further enhanced when restricting the equity and bond position to be non-positive. This comes at the cost of lower general performance and unfavorable cross-market effects, however. Indeed we find that a non-positive equity (bond) restriction worsened the performance during a bond (equity) market decline.
Finally, in Section 6, we provide concluding remarks.
1. Kaminski (2011) defines crisis alpha as “profits which are gained by exploiting the persistent trends that occur across markets during times of crisis”. 2. Past performance is not indicative of future results.
You are now leaving Man Group’s website
You are leaving Man Group’s website and entering a third-party website that is not controlled, maintained, or monitored by Man Group. Man Group is not responsible for the content or availability of the third-party website. By leaving Man Group’s website, you will be subject to the third-party website’s terms, policies and/or notices, including those related to privacy and security, as applicable.