Key takeaways:
- Trend-following strategies excel in sustained drawdowns but struggle with sudden volatility spikes, requiring an alternative first line of defence
- Long-short quality strategies offer protection during market sell-offs, benefiting from ‘flight-to-quality’ events
- Integrating both strategies provides a balanced defence, aiming to improve overall portfolio performance during volatile periods
Trend-following has historically performed well during more sustained drawdowns. However, performance over shorter and more volatile episodes is akin to a roll of the dice.
Practitioners have often touted trend-following strategies as being ‘long volatility’1 . While this statement may hold true when evaluated over weeks or months, it can cause confusion during sudden, short-lived volatile periods, such as the collapse of Silicon Valley Bank in March 2023 and the yen carry trade unwind in August this year. In both instances, we saw a rapid increase in volatility (as represented by CBOE Volatility ‘VIX’ Index), sharp reversals across markets and the underperformance of trend-following strategies.
The key issue is the sharpness of volatility spike. Trend-following has historically performed well during more sustained drawdowns, lasting months or longer. However, performance over shorter and more volatile episodes is akin to a roll of the dice and depends on how the strategy is positioned at the onset of the volatility.
These events highlighted the limitations of trend-following as a first line of defence in portfolios. To address this, combining trend-following with complementary strategies like long-short quality can provide more reliable protection and enhance portfolio defensiveness. In this paper, we explore how these strategies can work together effectively.
Rolling the dice
Figure 1 highlights the unpredictability of trend-following returns during sudden volatility shocks. We plot the 3-day forward change in the level of the VIX volatility index against the forward 10-day return of the Société Générale (SG) Trend Index—an index of ten trend-following managers designed to be representative of the managed futures space—dating back to 2000. We opt for a 3-day window for the VIX index as it aligns with the duration of the volatility spike in August, and a 10-day window for the SG Trend Index, as this is typically much shorter than the trends the trend-following industry attempts to capture.
Figure 1: Trend-following performance during volatility spikes
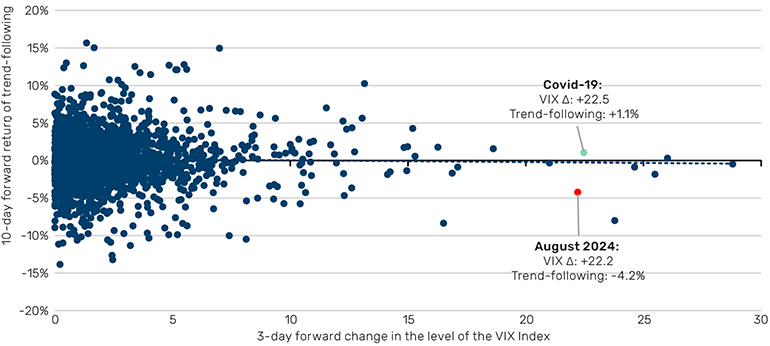
Source: Société Générale and Bloomberg; between 1 January 2000 to 31 August 2024. Trend-following represented by SG Trend Index.
The dice are loaded in trend-following’s favour when the initial volatility spike is followed by a protracted window of deleveraging across markets.
At first glance, it is obvious that trend-following performance during rapid volatility spikes follows no discernible pattern. For instance, the initial VIX spike during the Covid-19 outbreak in March 2020 (green dot in Figure 1) was profitable for trend-following, with the SG Trend Index gaining +1.1% as a result of long fixed-income and US dollar positions. In contrast, in August 2024 (red dot in Figure 1), trend-following performance was sharply negative (-4.2%), with long stocks and US dollar positions being the main culprits. As we said, a roll of the dice.
Where the dice are loaded in trend-following’s favour, however, is when the initial volatility spike is followed by a protracted window of deleveraging across markets, à la the Dotcom bubble and the Great Financial Crisis. Here, trend-following comes into its own, with its ‘crisis alpha’ properties and observed positive skew (as discussed in a previous paper) generating a worthy second line of defence in portfolios.
Loading the dice
But what about a first line of defence? Option-based strategies, such as a rolling long put, fit the bill but they are expensive. We propose a long-short quality cash equity strategy, which we have highlighted before. Intuitively, these strategies should benefit during a sudden sell-off in risk assets, which generates a ‘flight-to-quality’ effect in markets.
To illustrate this, we replicate the analysis of Figure 1 to observe the 10-day forward performance of a long-short quality strategy2 from the onset of the same 3-day duration volatility spikes. As we noted here, the strategy has been constructed in a dollar-neutral way, which results in a negative correlation to equities. While this negative equity beta undoubtedly contributes to performance during a ‘flight-to-quality’ event, we find that an internally constructed beta-neutral strategy exhibits positive convexity over the same 10-day window following a volatility spike.
Figure 2: Performance of long-short quality during volatility spikes
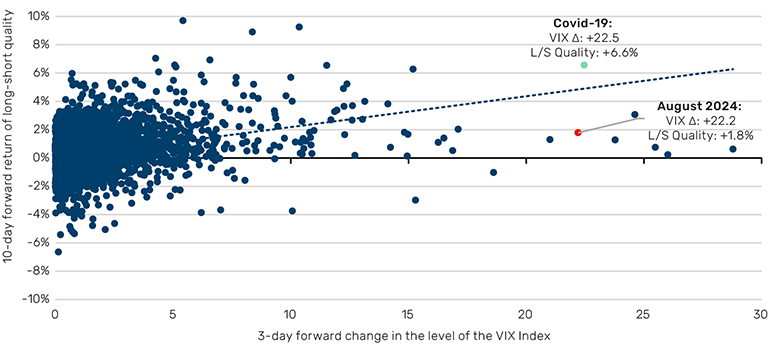
Source: AQR Capital Management and Bloomberg; between 1 January 2000 to 31 August 2024. Long/Short Quality represented by QMJ Global Daily Returns.
In contrast to the observations made for trend-following, sudden increases in volatility typically benefit long-short quality strategies, which profited during both the Covid-19 and August 2024 events.
Beating the house
Figure 1 suggests that the vulnerability of trend-following may be dependent on how the strategy is positioned coming into the spike, or more specifically, whether it is positioned to benefit from a ‘flight-to-quality’ event or not.
Assuming that bond positioning is a key determinant here, in Figure 3 we plot the 10-day forward performance of long-short quality and trend-following strategies during the periods where the VIX has increased by five points or more (97th percentile of moves) over the same 3-day window. The points are then colour-coded based on whether trend-following is long and short on bonds prior to the spike.
Figure 3. Performance of long-short quality and trend-following during volatility spikes, conditional on how trend-following is positioned in bonds prior to the spike
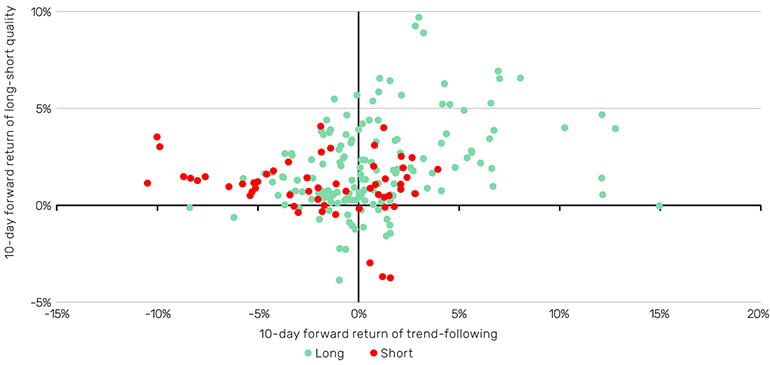
Source: Société Générale, AQR Capital Management and Bloomberg; between 1 January 2000 to 31 August 2024. Long/Short Quality represented by QMJ Global Daily Returns. Trend-following represented by SG Trend Index. Trend-following positioning based of Société Générale’s SG Trend Indicator.
While leaving things to a roll of the dice may appeal to some, those seeking more certainty could consider a long-short quality strategy to supplement trend-following.
Straight away, we can see that long-short quality strategies are well-suited as a first line of defence, with positive returns in nearly 90% of cases. In contrast, trend-following is positive only half the time, with an average return of 0.1%. What drives this uncertainty becomes clearer when we consider how trend-following is positioned coming into a spike, with the average return increasing to 0.9% when the strategy is long bonds, compared to a loss of 2.0% when it is short. This is intuitive as during a ‘flight-to-quality’ event investors flock to safe-haven assets, such as bonds. Of course, bonds are not the only potential explanatory variable here; positioning in other safe-haven assets, such as the US dollar, will likely also play a part, as would trend-following’s overall equity beta.
Ensuring that trend-following is positioned the right way, however, is unfeasible. While leaving things to a roll of the dice may appeal to some, those seeking more certainty could consider a long-short quality strategy to supplement trend-following and bolster defensiveness. For those looking to load the dice further, adjusting allocations based on how defensively trend-following is positioned can enhance strategic advantage, turning chance into calculated opportunity.
All data Bloomberg unless otherwise stated.
1. Fung, W., and D. Hsieh, “Empirical Characteristics of Dynamic Trading Strategies: The Case of Hedge Funds”, The Review of Financial Studies, 2, 275-302.
2. Asness, Cliff S. and Frazzini, Andrea and Pedersen, Lasse Heje, Quality Minus Junk (June 5, 2017). Available at SSRN: https://ssrn.com/abstract=2312432 or http://dx.doi.org/10.2139/ssrn.2312432. Daily returns available at https://www.aqr.com/Insights/Datasets
You are now leaving Man Group’s website
You are leaving Man Group’s website and entering a third-party website that is not controlled, maintained, or monitored by Man Group. Man Group is not responsible for the content or availability of the third-party website. By leaving Man Group’s website, you will be subject to the third-party website’s terms, policies and/or notices, including those related to privacy and security, as applicable.