Sunderland or Sussex? For UK households, the decision to rent or buy depends not only on personal preferences about where to live but also on the relative cost of occupying a home, which is heavily influenced by interest rates. Crucially, these economic dynamics vary significantly across regions. For institutional investors, such regional disparities often present opportunities to align portfolios with evolving affordability trends.
High mortgage rates, which currently stand at approximately 4.5%, have made renting the prevailing choice in costly regions such as the Southeast, driving sustained demand in the private rental sector. However, in more affordable areas like the Midlands, Yorkshire, and the Northwest, where rental yields have historically been higher, the barriers to home ownership are lower, particularly once interest rates fall. These trends have profound implications for rental growth, tenant demand, and long-term portfolio strategies.
The geography of affordability
Affordability is the cornerstone of housing demand, but it is not evenly distributed across the UK. In Sunderland, where house prices are lower relative to incomes, home ownership is far more accessible than in Sussex, where affordability is stretched. Rising interest rates have amplified these regional divides, increasing mortgage costs and pushing more households into the rental sector.
Since 2000, the number of households renting privately has more than doubled, from 2 million to 4.6 million, according to the 2023 English Housing Survey (EHS). Over the same period, average house prices in England rose from £81,000 to £302,000 (Office of National Statistics). This rapid growth has priced out many would-be buyers, particularly in high-cost regions, while sustaining rental demand.
The map below shows the regional variation of home ownership affordability across England. Large parts of the country now exceed 10x house price-to-household earnings multiples, making renting a more practical tenure choice.
Figure 1. Regional variation of home ownership affordability across England
Problems loading this infographic? - Please click here
Source: Rightmove, Man Group. House price affordability is calculated as the upper quartile price of a three-bedroom house in an outcode divided by the median income in that outcode. The shift from purple to orange occurs at 10x price: income ratio.
Interest rates: a catalyst for change
Most renters would rather own a home than rent - 59% of renters surveyed in the EHS expected to buy at some point in the future, with 77% of those aged 16 to 24 the most likely to express a desire to buy. For those households not expecting to buy, 75% cited affordability as the key issue. Household perceptions of affordability are largely shaped by monthly mortgage payments – tied to interest rate levels – and the size of the required deposit.
We consider a household’s decision to rent or buy a house as being driven by two factors:
- Is the cost of a mortgage lower than renting?
- Is the required deposit affordable?
The map below shows how these two variables interact for households. For each outcode in England, we evaluate the cost of servicing an 80% loan-to-value (LTV) mortgage at current interest rates for a median-income household in that area, comparing it to rental costs and calculating the deposit needed to meet bank lending criteria.1 An outcode refers to the first part of a UK postcode, which identifies a specific geographic area or district. It is often used in regional analyses to compare housing trends.
This leads to one of four possible outcomes in a household’s decision to buy or rent:
1. ‘Show me the keys’ - Mortgage costs < rental costs, and they need less than £100,000 in savings to make the mortgage affordable
2. Tighten the belt to buy - Mortgage costs > rental costs, and they need less than £100,000 in savings to make the mortgage affordable
3. Rent now and buy later - Mortgage costs < rental costs, and they need more than £100,000 to make the mortgage affordable
4. Renting is the way - Mortgage costs > rental costs, and they need more than £100,000 to make the mortgage affordable
Figure 2. At current interest rates, renting is the most affordable option in the Southeast and urban centres
Problems loading this infographic? - Please click here
Source: Rightmove, Man Group.
Figure 2 shows that at current interest rates, renting remains the more affordable option in much of the Southeast and in urban centres.
The table below shows the number of outcodes that fall into each of the four groups above.
Figure 3. Number of outcodes that fall into each of the rent or buy options
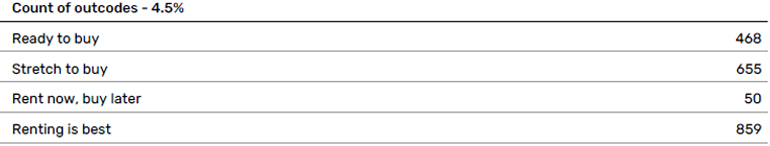
Source: Man Group.
However, if mortgage rates fall to 3.5%, the picture changes dramatically: large areas of the Midlands, Yorkshire, and the Northwest become viable for home ownership.
Figure 4. A drop in rates makes home ownership more affordable in parts of Midlands, Yorkshire and Northwest
Problems loading this infographic? - Please click here
Source: Rightmove, Man Group.
Again, the table below shows the number of outcodes that fall into each of the four groups.
Figure 5. Number of outcodes that fall into each of the rent or buy options
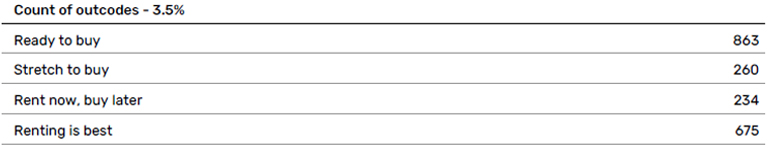
Source: Man Group.
This shift is evident when mapping affordability at different interest-rate levels. At 4.5%, only 468 outcodes in England are affordable for the median-income household. At 3.5%, this number rises to 863, with most of the change occurring in the North and the Midlands.
For investors, this highlights the importance of considering interest-rate movements and their regional impact. High-cost regions are likely to sustain rental demand as affordability remains constrained, while more affordable areas could see ownership demand rise if borrowing costs decline.
What this means for investors
The regional and interest-rate dynamics shaping the rent-versus-buy decision offer both risks and opportunities for institutional investors:
1. Focus on high-demand rental markets:
Regions such as the Southeast and major urban centres, where renting remains prevalent, are expected to deliver sustained rental demand throughout the rate cycle. These areas are well-suited for long-term rental portfolios, though investors must be prepared to accept initially lower rental yields
2. Target value-add opportunities in the North and Midlands:
In regions like the Midlands, Yorkshire, and the Northwest, falling interest rates could unlock significant home ownership demand. Value-add strategies, such as repositioning rental properties for sale, can capitalise on these affordability shifts, potentially delivering attractive returns
3. Careful underwriting:
While we highlight broad regional variations, there are areas which buck the trend. For example, in Manchester and the north coast of Norfolk, renting should remain the preferred option in a lower rate environment. Careful underwriting is critical to understand the drivers of these local differences
Conclusion
The choice between Sunderland and Sussex is emblematic of the broader regional disparities shaping the UK housing market. For institutional investors, these disparities - magnified by interest-rate movements - may offer opportunities for different investment strategies and to optimise portfolio allocation. High house price regions like the Southeast will continue to support rental demand, while more affordable areas in the North and Midlands present opportunities for value-add and ownership-driven strategies.
1. Analysis is based on upper-quartile three-bedroom house prices.
You are now leaving Man Group’s website
You are leaving Man Group’s website and entering a third-party website that is not controlled, maintained, or monitored by Man Group. Man Group is not responsible for the content or availability of the third-party website. By leaving Man Group’s website, you will be subject to the third-party website’s terms, policies and/or notices, including those related to privacy and security, as applicable.