Key takeaways:
- The US stock market is as expensive as it has ever been. Other markets are cheaper in comparison, but no region is offering attractive multiples on a time-series basis. Historically, a major US market downturn has impacted other global markets
- Inflation acceleration is, for me, the key sensitivity in the market discount rate. At current valuations, rising inflation is a key downside risk
- Euphoric sentiment is evident in some bellwether stocks trading on large multiples. In an inflation acceleration scenario, this is probably the most flammable material
I’ve just returned from three weeks’ leave (thank you, Man Group) following the birth of my fifth child. A girl, Cordelia, mother and baby all well, in case you wondered. Temporarily stepping away from markets can provide unusual clarity when one comes back to them, so in this note, I set out the shape of things as I see them shortly after my return, before the clouds of the everyday roll in.
Inflation
In the 10 years prior to COVID (i.e., 2009-19), US inflation annualised at 1.8%. In the four-and-three-quarter years since, that number has risen to 4.6%. The long-run market expectation is around 2.5%: Figure 1 shows my preferred way of tracking this (see the footnote for constituent parts). So the market is perhaps pricing 70 basis points (bps) of inflationary regime-change from the old world. In my view, this is not enough. I think three is the new two.
Figure 1: US long-run inflation expectation aggregate
Problems loading this infographic? - Please click here
Source: Bloomberg, Man Group. Calculated as 10% University of Michigan 5-10 year expectation, 22.5% each of USD 5Y5Y, US 10-year breakeven, Cleveland Fed 10-year expectation, Wall Street’s long-run estimate.
There are a few reasons for this, but one I’ve been reflecting on is central banks. It should be noted that the Fed has explicitly given up on one percent, which is, by implication, the true target if you assume Flexible Average Inflation Targeting (or FAIT), the outcome of the infamous framework review at Jackson Hole 2020. This abandonment was confirmed in this year’s iteration of the conference, where the A got dropped, and FAIT became FIT. Who comes up with these acronyms??
So average is out but flexible stays. And I suspect that, more than ever, it is front-of-mind for policymakers. So expectations could adjust another 50 bps higher. Which is not pocket change, given…
Valuations
The US stock market is basically as expensive as it has ever been. Figure 2 shows the average percentile of the eight metrics listed on the bottom right of the chart.
Figure 2: US valuation percentile (higher = more expensive)
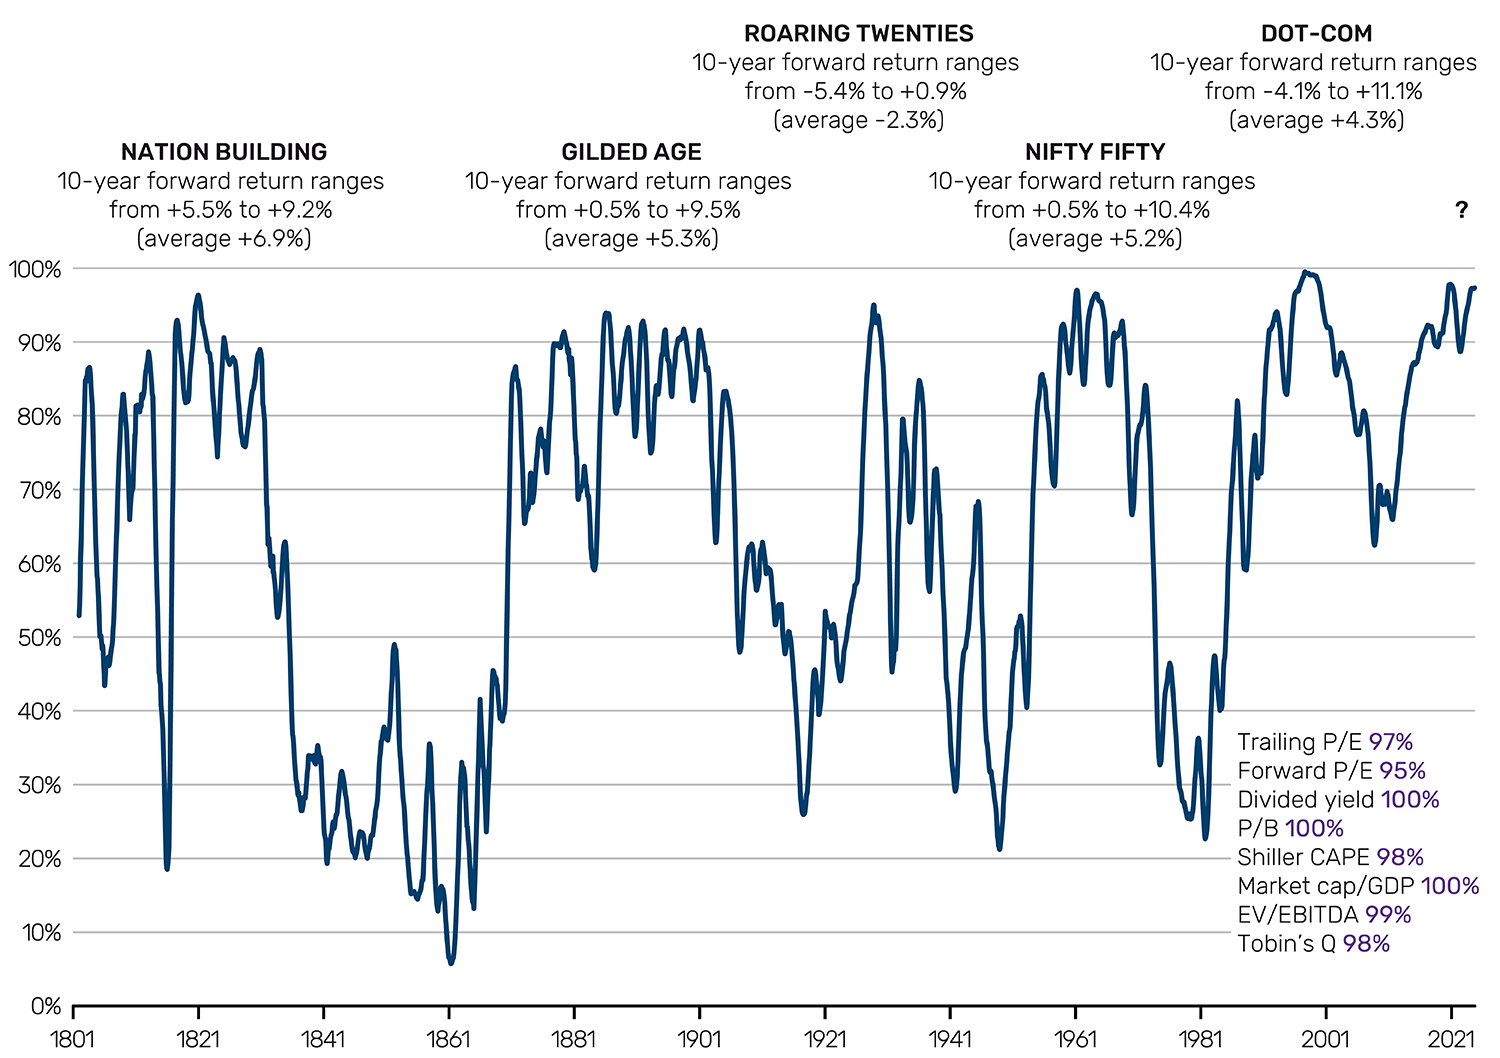
Source: GFD, IBES, Bloomberg, Shiller. Percentiles calculated on expanding window basis from start of the sample period, and smoothed on a 12-month moving average basis. Forward returns refer to each episode where the valuation percentile is above 90%. Annotated numbers are nominal and annualised.
Yes, other markets are cheaper in comparison, but no major stock market (at least that I’m aware of) is offering attractive multiples on a time series basis (i.e., in comparison to its own historic valuations). If the US crashes, there’s a good chance most other markets will too, in sympathy, and as financial market conditions tighten. The gravitational pull you have as the elephant in the bourse.
At the top of Figure 2, I have listed minimum, maximum and average 10-year forward returns (annualised) in each of the prior five episodes where this metric was above the 90th percentile. US stocks do 9% over the very long run. The averages (shown in brackets) are all considerably below this. But the ranges are large. There have certainly been times when you could have bought stocks above the 90th percentile and still made a handsome return. Indeed, in the Dot-Com bubble, this aggregate first breached 90 in late 1992. An investor who sold on that signal would have missed years of gains before being vindicated by the market's peak in 2000.
Which brings us back to inflation. Why does a bubble burst when it does? Why not a year earlier? Or later? In my view, a lot of it has to do with inflation accelerations. Dot-Com peaked in March 2000. Year-on-year CPI had accelerated 210 bps over the prior 24 months. Nifty Fifty peaked in November 1968, following a 380 bps rise over the last four years.
US inflation was 7% in 2021, 6% in 2022, 3% in each of 2023 and 2024, annualising at 2.7% year to date. At risk of patronising your mental arithmetic, none of these numbers are two. An acceleration from here is, for me, the key sensitivity in the market discount rate. With the multiple – a kind of proxy for equity duration – this high, we can expect some rigorous downside if inflation moves north.
Sentiment
Perhaps surprisingly given the breathlessness of the AI commentary, many commonly watched sentiment signals, while optimistic, are some way from GREED. My checklist is: AAII bulls minus bears; CFTC net non-commercial Nasdaq position as a percent of open interest; VIX; EUR core-periphery spread; USD high yield spread and S&P weight required to get a 10 vol. portfolio. All transformed to percentiles on a three-year lookback. On this basis, only the latter two look to be getting out of hand.
More anecdotally, however, there are signs of irrational exuberance. As well as inflation acceleration, a sharp move lower in stocks whose multiples are most obese offers another reality check for overly-optimistic valuations. In Dot-Com, for instance, Pets.com, Webvan, TheGlobe.com and all the rogues gallery of profitless tech were already in freefall by the time the overall market peaked in March 2000. Indeed, some of the establishment tech names didn’t ring the bell until well after that. Intel, for example, was trading at its highs as late as September.
So who are these early warning names today? Perhaps the crypto hoarders. Strategy (formerly data analysis software) is down 30% from its highs. Or more starkly, Metaplanet (which formerly ran hotels) has fallen 70%. And then there are the more mainstream, but still valuation nosebleeders, which have yet to correct. I realise that Palantir is beloved by many, and I don’t want to be a hater. So if you’re beginning to rage as you read, let me start by telling you what you want to hear. Obviously, this is a completely different proposition to the crypto hoarders, or to the ’99 meme stock forbears. Palantir has a clear mission, a valuable one, and is executing highly effectively. But at 200x forward earnings, its valuation is highly sensitive to shifting long-term assumptions. In a scenario where earnings growth decelerates to 30% instead of an expected 60%, and the valuation multiple compresses to 50x, the value of the investment would halve by the end of the decade.
I suspect that these are the areas manifesting investor greed, and plenty of it. These are also likely the most flammable areas in the event of unexpected inflation. So watch them. They may act as a fire alarm, if I’m not torturing the metaphor.
Of course growth still seems robust. The much-watched Atlanta Fed GDPNow is pushing toward 4%. Second-quarter US realised GDP has just been revised up to +3.8%, suggesting minimal impact, at least for now, from President Trump’s trade salvos. Unemployment is rising but, at 4.3%, is not terrifying. Wage growth and consumption are good. It is true that the housing (per the NAHB survey) and physical manufacturing (ISM) sectors are not rosy. It is also true that growth metrics have historically had gap risk on the downside. And, I think, there is some validity in the argument that Tech capital expenditure is singlehandedly keeping it on the road. That’s an area which could also turn out to be brittle. The overcapacity concerns that surfaced around DeepSeek aren’t even wrapping the fish and chips anymore. And if you take Jensen semi-seriously when he says that when Blackwell comes out, you won’t be able to give away Hopper… That’s quite a bit of fast-forward you need to put on the depreciation schedules. Back a week and already confused. Sigh.
You are now leaving Man Group’s website
You are leaving Man Group’s website and entering a third-party website that is not controlled, maintained, or monitored by Man Group. Man Group is not responsible for the content or availability of the third-party website. By leaving Man Group’s website, you will be subject to the third-party website’s terms, policies and/or notices, including those related to privacy and security, as applicable.