Key takeaways:
- Bubbles present two-tailed risk: falling off a cliff on the one hand, missing out on upside in the euphoric final phase on the other
- Who really knows when that happens. But we can have more confidence in how that happens
- My top four risks: AI capital expenditure, fiscal sustainability, private markets and policy volatility
“These games you play, they’re going to end in more than tears someday.”
- Orchestral Manoeuvres in the Dark
I have only two wedding modes: refuse to dance, or get way too carried away and regret it the next morning. I need to find the middle ground as I grow more middle aged. Markets today are in the latter camp. Taking US equities as a bellwether, the market is up 87% over the last three years. A top five percentile reading over 100 years of data, surpassed in only seven prior episodes.1 It is natural in such circumstances to get a bit jittery. Surely it’s going to end in tears. Someday.
But the problem with bubbles is that someday can be a long time coming, therefore presenting two-tailed risk. On the one hand, there’s the risk the ground sinkholes beneath your feet. On the other, the risk that the dancefloor euphoria is just getting started. They’re about to play Summer of ’69. And you’re skulking round the edges like Banquo’s ghost.
Figure 1, which shows the US equity risk premium, captures this dilemma. Investors are being offered little more than zero to move off the risk-free curve. Based on historical analysis, just to return to the median level would require a 35% haircut. But it’s equally possible that we revert to peak Dot-Com euphoria of -200bps before the fall. In which case you could be leaving 51% on the table. No easy answers, but make sure you have a clear list of the biggest risks and then watch them closely. Here’s mine.
Figure 1: US equity risk premium (bps)
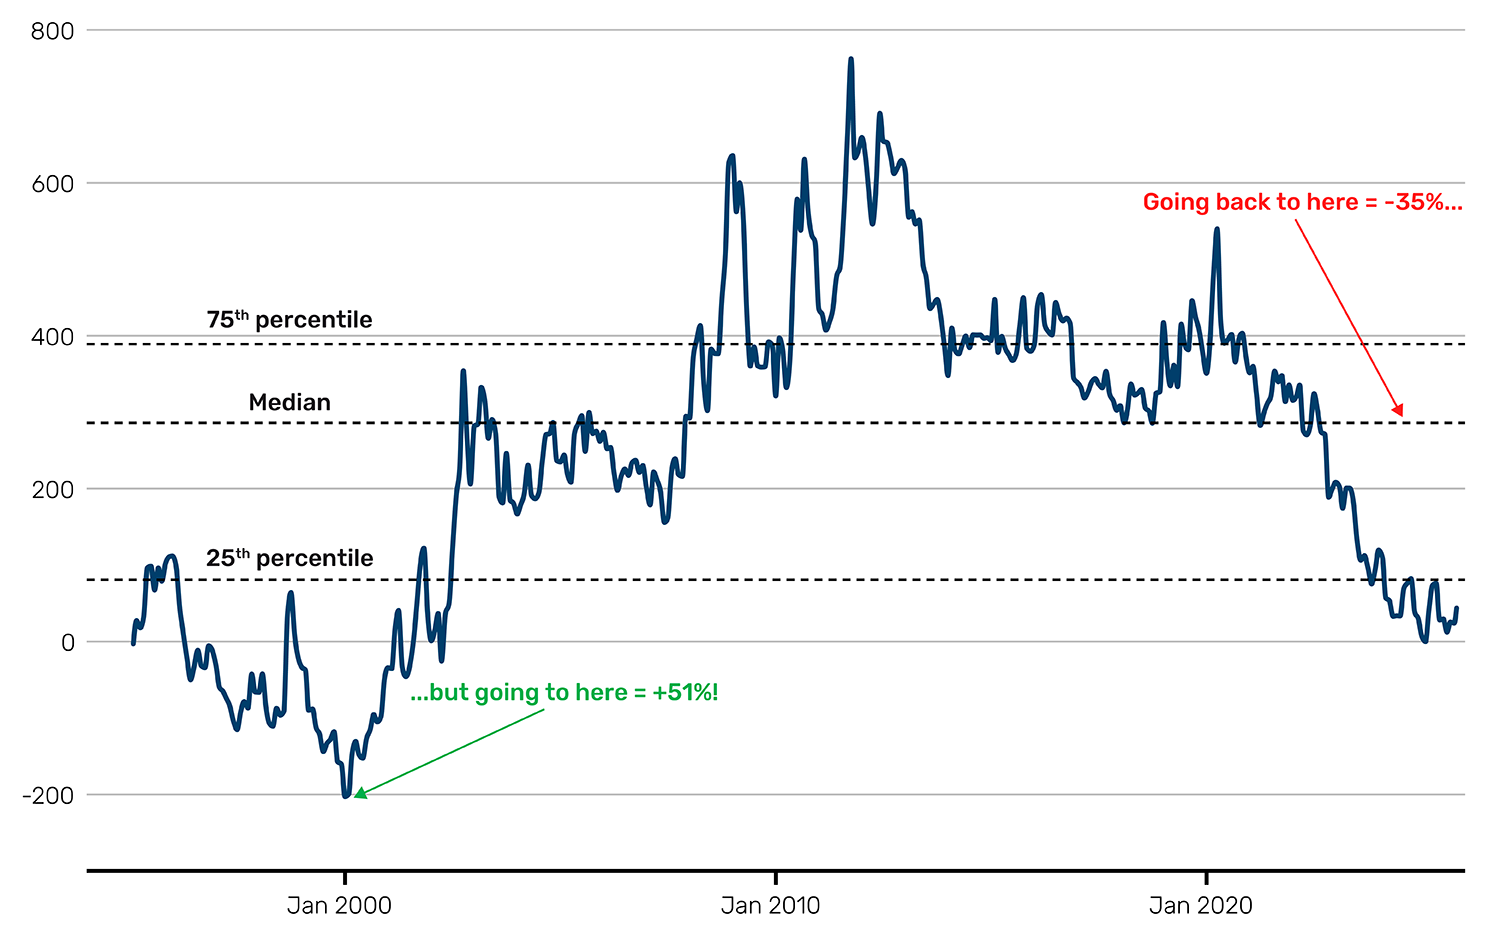
Source: Bloomberg, Man Group calculations. As of 21 October 2025.
Risk One: A disorderly unwind in the AI hype cycle
If Sam Altman and Jeff Bezos say it’s a bubble, you’ve a got to at least consider it might be just that. Here are five ways it pops. Russian doll lists within lists … sorry.
First, while there are many amazing anecdotes, and specific productivity revolutionising use cases (which I’ve seen), in the aggregate empirics, the revolution is MIA. BLS annualised productivity since 2022 (advent of ChatGPT) is 2.2%. Admittedly, this is an acceleration from the estimated 1.8% clip we were running pre-COVID, but it’s still a good way off the three-handles we were hitting in the 90s heyday. And with some of the more breathless advocates claiming AI will have similar effects to Prometheus stealing fire from the gods … well, we need to see a bit more.
Secondly, how do you monetise this? Or at least how do you monetise it like it’s 2015? Hindsight bias alert, but in Tech-hyperscaler round one (call it 2010 to 2020) the pathways felt clearer. The business model of social media, for example. Absorb every soul in the world onto your platform, and get them to pay for it without realising, via their eyeballs. Now, who knows what OpenAI has in its back pocket, so this could change quickly, but it is currently a business running the same model as Netflix. And while valuations of both are around US$500 billion, Netflix CEO Reed Hastings can point to 300 million paying subscribers. OpenAI has less than a tenth of that.
Thirdly, who monetises this? Tech hyperscaler round one was a less competitive place. Think back 10 years, and it was neatly demarcated: Apple did hardware, Microsoft did enterprise software, Facebook did social media, Alphabet did search, Amazon did retail. And so on. Today they’re all fighting over the same dance partner.
Fourthly, profitability. The tech giants have rapidly discovered the importance of fixed capital. And are shelling out hand over fist to get it. OpenAI alone has signed up to US$1.5 trillion of CAPEX commitments, or around 115 times current revenues. We simply do not yet know what the return on these investments will be. US$1.5 trillion was what they paid for it, we don’t yet know what it cost.
And finally, and related to this last point, the whole ecosystem has become so incestuous in terms of the deals between the different players, that any wobbles in one corner have the potential to metastasise extremely quickly.
The Dot-Com parallel is often made. One slightly ominous difference compared to then is that today we have both a crazy multiple story and a potential overearnings story. Dot-Com was really just about valuations, and earnings projections didn’t particularly move through the crisis. Per Figure 2, today we have two strands to recent performance. On the one hand, companies like Palantir, Cloudflare and Snowflake have re-rated from 10x price-to-sales to 26x over the past three years. That’s price-to-sales not earnings, mark. On the other, the blue chips may be on relatively reasonable multiples, but they are getting on for tripling revenues over the same timeframe. So in my view there is a risk that a sell-off today fires on two cylinders, the multiple and the denominator.
Figure 2: 12-month forward price-to-sales (top) and 12-month forward sales estimate rebased to 100 (bottom)
Problems loading this infographic? - Please click here
Problems loading this infographic? - Please click here
Source: Bloomberg, Man Group calculations. 21 October 2025.
Risk Two: Fiscal sustainability crisis
The fallout from former UK prime minister Liz Truss’s mini-budget was perhaps the first hint of how crystallisation of this risk looks. The baton was taken up in the US in the summer/autumn of 2023, where the US 10-year Treasury (UST10) yield hit 5%, and the S&P fell 10%. And now, I think most ominously, in France. At the time of writing, the mood music is better, with Sébastien Lecornu batting more solidly in his second innings, avoiding becoming the first- and second-shortest-serving Prime Minister of the Fifth Republic via a deal with the Socialists. But it’s the hope that kills you, and to me it feels that the slip cordon could go up at any moment.
France’s total non-financial debt to GDP is 322%, second only to Japan on 380%. For comparison, China is on 292%, the US is just 150%. The extent to which France is bound up in international financial plumbing tends to get underrated. A third of credit assets backing the euro are French assets, for instance. History tells us that what happens in France has a nasty habit of not staying in France. This time would likely be no different.
I would expect to see a profound reaction in the US term premium and long-end inflation expectations. The former, because investors will need more persuading to lend longer to profligate governments. France might be the spark, but the tinderbox is Western governments in general spending excessively. The latter because, ultimately, as much as people don’t like inflation, they dislike job insecurity more. And so policymakers, when pushed, will eventually go for inflation over debt deflation. Per Figure 3, both have moved up a bit, but it’s worth looking at the long history to see that it’s not much in the grand scheme. In a full-on fiscal sustainability crisis, I’d expect to see another 100 basis points on the term premium and another 50 on inflation expectations before you can say Paul Volcker. So the 10-year yield moves to 5.5%. Given where equity multiples are, I suspect that doesn’t feel very nice.
Figure 3: US 10-year term premium (left) and long-term inflation expectation (right)
Problems loading this infographic? - Please click here
Source: Bloomberg, Man Group calculations. As of 30 June 2025.
Risk Three: Skeletons in the private markets cupboard
I’ll be briefer on this one because, while the financial engineering might be complicated, the basic narrative is not. Which is that private markets have grown extremely fast and are expanding to a more retail investor base. Recent history has shown us that when complex investment chicanery and everyman investors come together, it can have unpredictable, and often bad, results.
Bain estimates the CAGR of private markets retail products since 2018 is 30% for private equity, 44% for real assets and 52% for private credit. The latter, in particular, is also increasingly tied into the AI story (see Risk One). Morgan Stanley estimates that around 30% of tech CAPEX today is funded by private credit. Which reminds us of an important point: while I’ve been discussing these risks in distinct terms, if we do get the BIG ONE, it probably involves cross-pollination between them. First Brands, Tricolor Holdings, Zions Bancorp etc. may end up being isolated incidents, but we know that credit has featured in the narrative of most major historical sell-offs – and has often been the dominating chord. Worth being alive to the possibility there are more cockroaches out there.
Risk Four: Policy vol. chicken comes home to roost
President Trump has taken the US’s effective tariff rate from 2% to 19%, the highest since the 1930s. If you’re sympathetic to him, you’d say he was a dynamic decision maker. If you’re not, you’d say TACO. Either way, a lack of consistency breeds uncertainty and uncertainty costs money. He has attacked institutions which support global economic interaction, perhaps most notably the Federal Reserve. His instincts are protectionist – at least by Republican standards – and very much not from the Adam Smith, laissez-faire school. Nvidia has to pay to trade in China. We now dabble in quasi-state-owned enterprises.
Nothing comes for free, and for me, it’s going to be US corporates picking up at least part of the tab. The market is relatively uninterested in this for now, with operating margin for the S&P at 15%. During the past 30 years, this was exceeded only briefly by the profitability boom coming out of COVID in 2021. The Street is expecting margin expansion beyond this zenith over the next two years. There is a very real risk that policy volatility jeopardises this balmy pathway.
And by the way, I see this as the primary driver behind gold’s 60% year-to-date move. We would do well to remember that the gold price on our screens is really just another FX pair, the meeting point between real and fiat money. I think the recent rally is as much a question mark over the fiat system, underpinned by the US dollar, as it is about the yellow metal itself.
Give us hard numbers. The cry goes up. And I’ll oblige. Figure 4 shows the bubble-burst dashboard I’m working off. Anyone who’s been around markets for any length of time knows that curveballs fly in from outside the data all the time, so don’t hold it too tightly. Moreover, the world being the uncertain place that it is, you’re never going to get 10/10 in ‘screaming face emoji’ poise on my highly scientific scale. So don’t wait too long either. The lights in the club come on suddenly. And there won’t be chants of ‘one more song’. There won’t be an afterparty. Just a lot of haggard faces at 4am, wishing they’d left at one.
Figure 4: Henry Neville’s market implosion dashboard
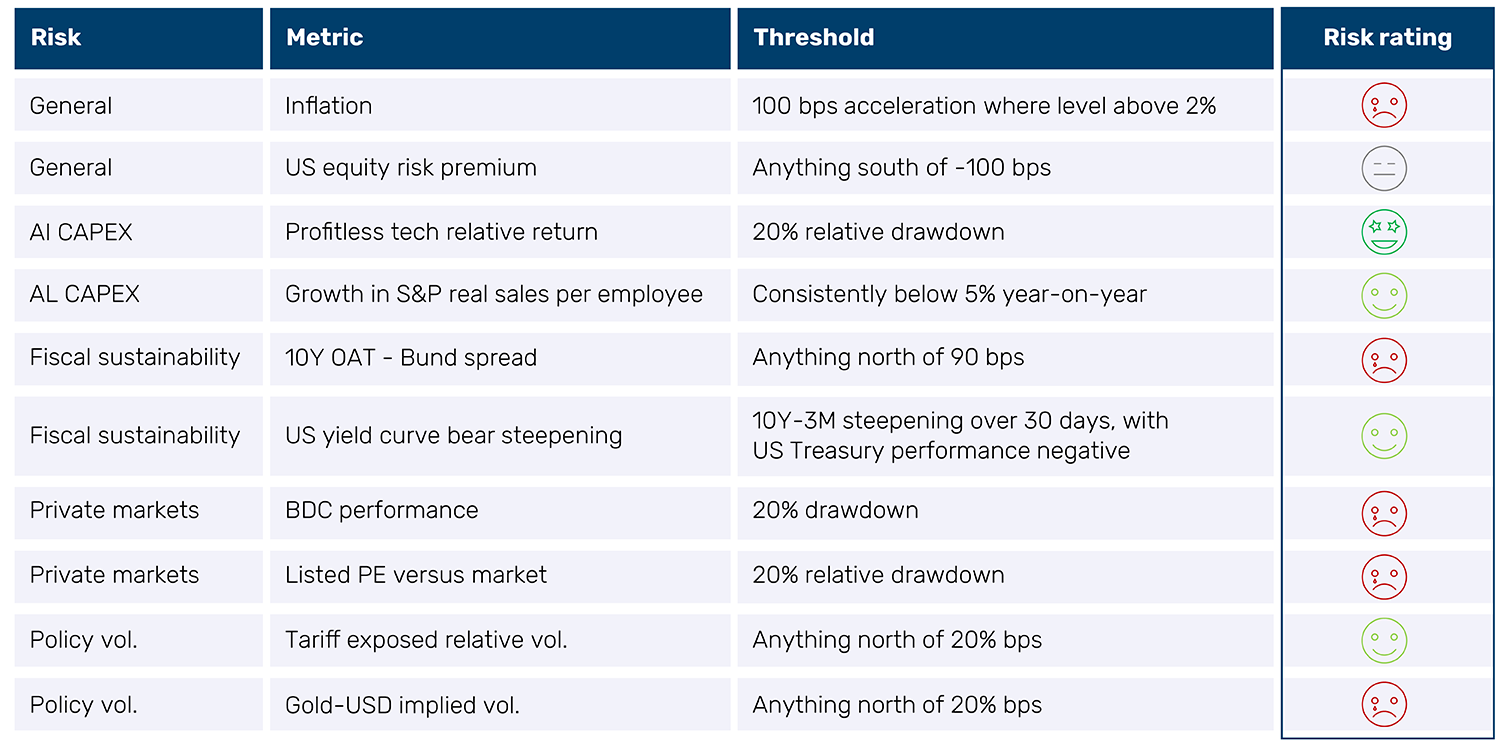
Source: Bloomberg, Man Group calculations and judgement. As of 10 October 2025.
1. For the pub quiz, these were the 2021 COVID recovery, the 2012 bounce out of the Global Financial Crisis, the boom side of Dot-Com, the late 80s boom prior to Black Monday, the mid-50s post-war exuberance, the end of World War Two, and the recovery from the Great Depression.
Source: Bloomberg, unless otherwise stated.
This material is for professional investors only. The views expressed are those of the author and do not necessarily represent the views of Man Group. Past performance is not indicative of future results. This material contains forward-looking statements based on current expectations, which are subject to change without notice.
You are now leaving Man Group’s website
You are leaving Man Group’s website and entering a third-party website that is not controlled, maintained, or monitored by Man Group. Man Group is not responsible for the content or availability of the third-party website. By leaving Man Group’s website, you will be subject to the third-party website’s terms, policies and/or notices, including those related to privacy and security, as applicable.