All market data referenced below sourced from Bloomberg unless otherwise specified.
The Marquess Cornwallis learned the folly of being a Brit telling America about its politics. And I’m wary of following in those footsteps. Plus, there’s been enough written on who’s going to win in November. I just ask Charles Myers and leave it at that. Rather, this piece is simply a reflection on ‘what happened in the past’. And specifically, a ‘what happened to key assets and strategies in and around prior elections?’ There haven’t been enough elections to speak with any sort of statistical purity. And, moreover, for those we have data for, there was often so much going on at the time that to disaggregate the election effect from other crosscurrents in a systematic fashion is near-impossible. Rather these are going to be a series of heuristics. Stick them in the ‘Sell in May…’ folder. There now, I’ve managed your expectations.
All told, which party benefits which strategy?
Figure 11 shows real annualised returns to key assets/strategies, distinguished by which party held the presidency, over the last 100 years.
First observation. Democrats are good for the stock market, Republicans are good for the bond market. The perception is that the GOP are fiscal hawks, balanced budget guys. The Dems, meanwhile, can be relied on to spend stupid amounts of money, get the champagne corks popping, juice the market and damn the consequences. It hardly needs saying that there are many instances where this is flat out not true, and indeed the last president to produce a surplus was Clinton. Still, it’s a good story, and to some extent the market swallows it.
Problems loading this infographic? - Please click here
Looking at other assets, commodities outperform in Democrat administrations, consistent with the fiscal largesse narrative I’ve alluded to. Trend and Cross-Sectional Momentum are both much stronger under the GOP. *Reaches for MAGA hat*. As has now been well-evidenced, momentum strategies have defensive characteristics2, so this fits with the more risk-off picture in the red years.
Value is the surprise, given we would expect it to benefit from a higher rates world, as well as a fiscal upturn, given its short-duration, cyclically-geared characteristics. Here, perhaps, an illustration of the average hiding a multitude of sins canard. Republicans have on their watch the Great Crash of 1929, the Nifty Fifty implosion of 1973, and most of the DotCom deflation. Correlation is not causation, we hasten to add, in the interests of strict neutrality. But these were all times when Growth stocks collapsed under a weight of schadenfreude.
How do these strategies perform in the build-up and aftermath of elections?
What about coming into and out of a presidential election? And does it make a difference if the contest is a tight one or not? In Figure 23 I show a 2x2 matrix, where the x-axis is the winning party, and the y splits these victories into tight and easy margins (defined as where the winner’s popular vote share was below/above 5%). Dark blue is the annualised real return in the six months prior to the election, aqua blue that of the six months post. The black lines denote the unconditional return through all history from 1925.
Problems loading this infographic? - Please click here
Equities and bonds are relatively similar going into and out of the easy wins to both parties. When the win is a foregone conclusion, it makes sense that not much upsets the cart. Interestingly, bonds are the other way around to what we found in Figure 1, soft through big Republican wins, strong through Democrat routs. Here again a couple of big moves are swinging the results. In 1972 Nixon won the popular vote by a huge margin of 23 percentage points, second only to Roosevelt’s 1936 victory following the New Deal (+24 points). The victory, later irrevocably tarnished by the Watergate scandal (and given the scale of the winning margin, he must have asked himself why he bothered) also came in the aftermath of Nixon’s shock decision to abandon the convertibility of the US dollar to gold, leading to rising yields. Even more marked was the bond sell-off around Reagan’s first victory in 1980, which coincided with the final flourish of the 1970s inflationary travails, and a clear headwind for the bond market. In real annualised terms the US 10 year fell 17% in the six months leading up to the poll and -14% coming out of it.
But while there are a couple of nuances, the broad point makes qualitative sense: in an uncertain election it is more likely that the market elastic will snap one way or the other once the result is finalised. The example of equities in the aftermath of tight Democrat wins is particularly notable, moving from 2% to 31%.
Two final observations. First, we saw in Figure 1 that commodities perform, on average, better in Democrat than Republican administrations, and Figure 2 hints that the early days of those regimes are particularly strong, with returns of 33% in tight wins, and 22% in the cakewalks. Possibly this reflects the blue penchant for announcing big infrastructure programs near the start of their tenure. And secondly, note that Value tends to perform strongly in the six-month aftermath of an election, no matter who wins and by what margin. I suspect this is part of the relief rally that follows the peaceful transition of power, wind in the sails for Value’s cyclical characteristics.
How does the equity market move day by day into and out of elections?
Increasing the magnification, Figure 3 looks at how the equity market moves on a daily basis, through the same time periods shown in Figure 2, and split in the same 2x2 matrix. For each chart, the fuchsia lines are the individual elections denoted in the subtitle and the dark blue line is the average. I highlight and title some notable outliers for each.
Figure 3. US Equities Daily in 6M Before and After Elections (Indices are Nominal, Rebased to 100 on the Day of the Vote)
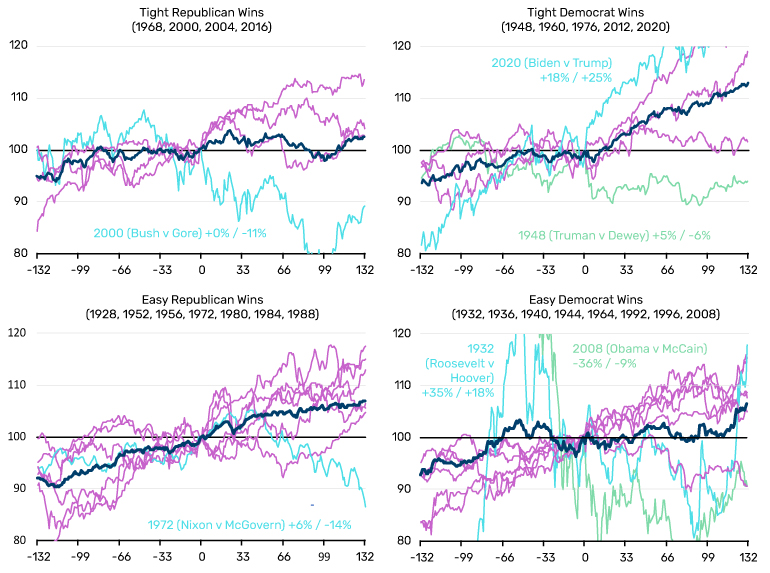
Three observations. First, stocks rise in nominal terms in the six months prior to the election in all but one instance (23/24 or 96%), with the only exception being Obama’s first victory, set to the backdrop of the GFC (see bottom right). There’s a logic to this: you don’t need to be part of the tin foil hat brigade to think that the top brass have a vested interest in keeping the show on the road in the build-up to the most important global plebiscite. Surely some strings get pulled behind the scenes.
Secondly, they also rise in the vast majority of cases in the six months following the poll. Specifically, in just six of the 24 (25%) are equities lower in the half year after the result. Moreover, in all of these six instances there were some fairly extenuating circumstances. Bush versus Gore (2000) (top left) occurred as the DotCom unwind was in full swing. Truman versus Dewey (1948) (top right) saw the post WWII slump. Nixon versus McGovern (1972) (bottom left) was Watergate, as already alluded to. We’ve already discussed postelection relief rallies in the context of Value outperformance. Sometimes the markets just want the whole thing to be over so they can start worrying about conventional earnings misses again.
Finally, volatility tends to fall into and out of the election, but tends to be higher around those won by the Democrats. In the median contest, equity volatility is 12.4% six months prior, falls 100bps to 11.4% on voting day, and drops a further 50bps, to 10.9%, in the half year following. The only calibration to buck this trend in aggregate are the tight Democrat wins. Here we see volatility falling from 13.2% to 11.1% into the election, but then rising to 12.4% in the aftermath. The overall pattern of falling standard deviations fits with the narrative of relief rallies as the market gains clarity as to the political texture of the next four years. Possibly the tight Democrat exception has to do with increasing unknowns where a party that, at least by reputation, is more activist, attempting to implement change through a divided bureaucracy.
Tldr
As caveated in the introduction, I don’t feel I have any particular edge in crystal balling the outcome. But here are some facts on the ground right now. It is currently close. Aggregated betting odds at time of writing are on the knife, with Trump on 6/5 (45.5% implied probability) and Biden on 5/4 (44.4%). But Charles Myers believes a Biden win is more likely. On the current lie of the land, it seems reasonable to assume it will be a tight contest, in other words the playbook of the top row of charts in Figures 2 and 3.
IF Biden were to lose, he would join a relatively rarefied list of presidents who have lost their second election. Assuming we don’t have a recession starting in the next six months, he would join an even more exclusive club of those who have lost without an economic downturn. Indeed, since the start of the NBER business cycle data in 1854, only nine men have been one-termers.4 Of these nine not one has ‘achieved’ the feat without a recession on their watch. It’s the economy, stupid.
So maybe that biases your base to the top right quadrant of Figures 2 and 3. Which as an automaton would mean you were long bonds and cross-sectional Momentum going into the vote, and buying stocks, commodities and Value for the aftermath. But perhaps the more obvious takeaway is that historic precedent says you need to look elsewhere to get your catalyst for a stock market sell-off. The market is almost always up in build-up, it’s usually up afterwards. No shortage of potential candidates.
1. For equities we use the Kenneth French data. Bonds use the Bloomberg Barclays 7-10 Year Treasury Aggregate Bond Index where it becomes available and before that a variety of archive sources. Commodities uses AQR’s equal weight commodity future index and then the Bloomberg Commodity Equal-Weighted Sector TR Index. L/S Equity Value and SX Mom. are the Fama-French HML and Mom. factors, respectively, with cash rate added back and net of 2% costs. Trend is a proprietary historic backcast built by Man AHL going back to 1900 – net of a performance haircut of 50% of the average excess return over that period. That splices into the Société Générale Trend peer group where that becomes available.
2. See, for instance, https://www.man.com/maninstitute/best-of-strategies-for-the-worst-of-times
3. All asset data the same as for Figure 1.
4. Including Grover Cleveland. As a by-the-by the only man to have served non-consecutive terms. If Trump were to win, he would be the second. The other eight one-termers are Pierce, Buchanan, Harrison, Taft, Hoover, Carter, Bush Sr. and Trump.
You are now leaving Man Group’s website
You are leaving Man Group’s website and entering a third-party website that is not controlled, maintained, or monitored by Man Group. Man Group is not responsible for the content or availability of the third-party website. By leaving Man Group’s website, you will be subject to the third-party website’s terms, policies and/or notices, including those related to privacy and security, as applicable.