What if Markets Are Wrong Again on Rates?
According to Warren Buffet, Mr Market is often wrong. This truth of this principle has been demonstrated again, with markets estimates of the level of interest rates (as measured by the 6-month 6-month Eurodollar futures curve) undershooting the actual level of rates as measured by 3-month Treasury rates (Figure 1). Furthermore, the implied Eurodollar curve shows rates rising to 5% by 2023, more than a full percentage point higher than the curve implied in June.
We previously wrote about the potential for branching futures: if markets were correct that inflation would peak soon, and that consequently rates would peak at around 4% in late 2022 before slowly falling, this would be a positive for risk assets. Conversely, markets could well underestimate how continued inflation might force the hand of central banks, with rising rates continuing to cause selloffs.
It is clear that we are very much experiencing the latter scenario, where central banks are having to raise rates further and for longer than investors anticipated in June. This throws up an intriguing question: if markets have underestimated inflation once, could they be wrong on rates again? And if so, what might the implications be?
If we assume that rates reach – then fall away from – the current 5% level, the consequences may be relatively muted. While GDP forecasts in the US have been revised down (2022 GDP from 2.9% to 1.5% and 2023 from 1.2% and 0.5%), they are still within positive territory1. With 20% of the S&P 500 index having reported their Q3 earnings at the time of writing, some 72% of stocks beat analysts’ estimates. Likewise, default expectations are muted, with Fitch projecting defaults to be between 2.5%- 3.5% in 2023. Taken in the round, this wouldn’t require the Fed to pivot further, and would likely support both credit and equity strategies.
However, if we see inflation continue to remain high, 5% interest rates would be a pipe dream. The Fed has shown itself to be decisively committed to controlling inflation via rate hikes. This would filter immediately to risk assets, transferring pain to high gross, long-biased equity and credit strategies, as well as CTAs. A prolonged risk-off window would also heap pressure on private markets, possibly forcing managers to realise losses which have so far remained on paper.
Factoring in the potential for an entirely separate exogenous shock, there are more than enough reasons for the downside risk to be higher than markets are currently pricing. Asset managers be warned.
Figure 1. 6-Month 6-Month Eurodollar Futures Curve Versus Actual 3-Month T-Bill Rate
Problems loading this infographic? - Please click here
Source: Bloomberg, Man FRM; as of 25 October 2022.
Quis Separabit? The Return of Positive Stock Bond Correlation
It is rare that markets conspire to prove a five-year old thesis correct. We argued that a negative correlation between equities and bonds was a phenomenon that dated back only 20 years. That the ‘equities go down, bonds go up’ mantra that many multi-asset portfolios were counting on in times of crisis was in fact a symptom of inflation’s absence (Figure 2). Should an inflationary environment return, a positive correlation would reassert itself with a vengeance.
This is borne out by both general correlation data but also hourly data (Figure 3). It is notable that while the overall positive correlation is 0.6, the most volatile hours show the highest correlation. In essence, the more risk assets sell off, the more they sell off together.
With stocks and bonds sinking together, the time has come for asset managers to reconsider the risk in the 60-40 portfolio. As we transition to an inflationary regime, investors do have options: trend-following, commodity allocations and multi-asset frameworks all provide alternatives to the 60-40 and, historically, have performed better in inflationary environments.
Figure 2. Slow Stock- Bond Correlation (Trailing 10 Years, Monthly Periodicity)
Problems loading this infographic? - Please click here
Source: Bank of England, Bloomberg, Man DNA; as of 5 October 2022.
Figure 3. Hourly Returns on 10-Year US Bonds and S&P 500 Index Since 1 October 2022
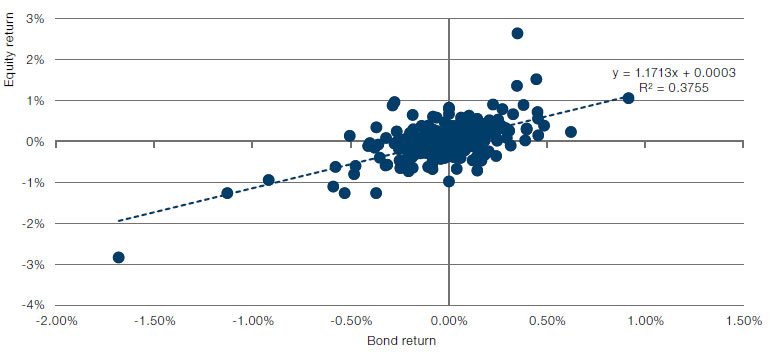
Source: Bloomberg; as of 25 October 2022.
The Devil Take the Hindmost
Being a central banker isn’t easy. Indeed, we have repeatedly expressed sympathy for those who take on this often thankless role. But spare a thought for the Bank of England (‘BoE’). Having won a battle of wills to stabilise the gilts market, it faces the prospect of all its good work being undone during its meeting on 3 November.
The relative of importance of real yields as opposed to nominal yields is most crucial here. Figure 4 shows the timing of central bank and political interventions during the past month. UK defined benefit pension schemes had significant exposures to real rates, which moved far more sharply than nominal yields in response to the mini-budget and subsequent political turmoil. Real yields saw their biggest selloff in 30 years on 28 September, with nominal yields moving much more slowly. A further collapse in the index-linked gilt market on 10 October prompted further intervention, and soon after, the resignation of the Chancellor of the Exchequer Kwasi Kwarteng. After a volte face on the government’s economic programme and the replacement of Kwarteng with Jeremy Hunt, followed by the resignation of Prime Minister Liz Truss, both nominal and index-linked gilt markets stabilised. While the spectacle may have been unedifying, the BoE was not forced to extend its purchasing programme, gilt markets remained functioning and defined benefit schemes did not collapse.
However, real rate exposures in pension schemes have not gone away. With targeted returns far exceeding the yields on offer in the uniquely low rates environment of the past decade, pension schemes have contorted their portfolios into some odd shapes to maintain exposures to ‘less risky’ assets such as gilts while attempting to keep the schemes funded. As such, the pressure is only off the pension schemes temporarily. If the BoE fails to maintain the same pace of rate hikes as other central banks, we may see real yields spike sharply again, returning us to square one. On the other hand, with UK homeowners highly levered and their mortgage repayment rates fixed for relatively shorter timeframes, an aggressive hiking cycle is likely to cause significant turmoil in the UK property market.
In the short-term, the BoE has little option: the devil will take the hindmost central bank if they do not keep pace. But over the medium term, the UK’s housing market makes a sharp hiking cycle an equally unattractive option.
Figure 4. 15-Year Nominal Gilt Yield Versus 15-Year Index Linked Gilt Yield
Problems loading this infographic? - Please click here
Source: Bloomberg; as of 28 October 2022.
With contributions from: Adam Singleton (Man FRM – Head of Investment Solutions)
1. Source: OECD.
You are now leaving Man Group’s website
You are leaving Man Group’s website and entering a third-party website that is not controlled, maintained, or monitored by Man Group. Man Group is not responsible for the content or availability of the third-party website. By leaving Man Group’s website, you will be subject to the third-party website’s terms, policies and/or notices, including those related to privacy and security, as applicable.