Will Inflation Kill the Central Bank Put?
The Greenspan era ushered in the concept of the Federal Reserve put. Over the ensuing decades, markets have become accustomed to monetary policy responses to financial crises and stabilising risk asset markets in times of crisis. The magnitude of the quantitative easing response has grown with each crisis; the cherry on top being the inclusion of corporate credit in Fed asset purchases with the Covid crisis.
And this isn’t just localised to the US. Other central banks were even more aggressive: the European Central bank bought sovereign debt across Europe, including liquidity strapped peripheral nations in 2011, as well as corporate credit. Japan has even included equity in their asset purchase programs.
While the Fed previously ruled buying credit and equities, their foray into credit in 2020 has investors counting on similar interventions going forward. A side effect of the advent of the Fed put has been that bond-equity correlations have remained reliably negative. This has allowed investors to comfortably keep using bonds, even at lower yields, as a diversifier to risk assets and has allowed the 60/40 to retain its dominance in the collective psyche of investors.
The risk of rising bond/equity correlations has been well covered in our own research and the media: the 60/40 becomes a fairly complex portfolio to manage if bond yields are very low, suggesting little return going forward, and bonds fail to diversify portfolios due to increasing correlations to risky assets. As we have noted before, hedging historically expensive equities with historically expensive bonds may prove difficult.
Adding inflation to the mix may upend the ‘normal’ order of things. For most of the year, markets have largely accepted the Fed narrative that high inflation numbers were of a transitory nature and thus, bond and equity investors looked past them. However, the recent soaring energy prices, supply bottlenecks, product shortages and rising labor costs have begun to undermine the perception that the current inflationary episode is truly transitory. What was originally perceived to be a short-term problem is clearly no longer the case: rising rents and home prices, coupled with explosive energy moves, may stretch well into next year.
Of course, most measures used by central bankers exclude food and energy. However, consumers and factories do not. There are thus clear effects on production and consumption from spiking energy prices. Furthermore, while central banks can do very little to resolve supply shortages or reduce energy prices, the effect on inflation expectations likely cannot be avoided. As a practical issue, investors should not be pleased to see very volatile energy prices begin to undermine valuations in bonds and equities.
The Fed put narrative in rising markets suggests that central banks remove accommodative monetary policies in order to have tools at their disposal in future crises. As in late 2018/early 2019, the Fed can reverse course as needed. However, the Fed may have waited too long to taper, leaving itself in the unwelcome position of having to withdraw liquidity now, regardless of market impact. The new inflation bands put forth by the Fed implied more flexibility around inflation overshoots; however, current levels may be well beyond what was contemplated, especially if not transitory.
All this leads to a question that should be central to investors’ minds: at certain levels of inflation, will the Federal Reserve be forced to continue to tapering or commence rate hikes irrespective of the impact on asset prices?
What might this mean for various asset classes?
If inflation is in control of the Fed’s mindset, we would expect more volatility going forward in risk assets. Tight credit spreads would seem at risk.
Post Covid, the narrative has been that central banks will bail out creditors and provide liquidity in market crises. In our view, that has been a somewhat naïve simplification of credit markets: central banks cannot resolve solvency issues, only provide liquidity.
Emerging-market debt has also been heavily supported by central bank policies. Tapering and rising bond yields may well further pressure those assets, especially if central banks constrained by inflation are unable to provide liquidity. Indeed, an example of a credit market without a buyer of last resort might well be Asian high yield. There is plenty of risky lending in US credit markets, including ever growing private credit investment.
Markets have already demonstrated the susceptibility of long duration equities (mainly tech stocks) to rising rates. However, rising rates and lack of the Fed put will bring into question the current market price-to-earnings (‘P/E’) ratio and the often-quoted yield advantage that equities have over 2-year notes. The effect is likely to go well beyond tech leadership with broader equity declines and liquidity issues across asset classes. In our view, it is not clear that investors are at all prepared for these outcomes.
A Sticky Situation? Not Quite Yet …
We tend to think of inflationary pressure gaining traction in an economy as a little bit like dying of hypothermia. Not that we have much experience in this regard but, so we’re told, it’s not the frostbite that kills you but when the cold seeps into your bones, to your very heart, precipitating the failure of your internal organs.
Similarly, while used cars may whip around, we’re interested in the items right at the heart of the CPI basket whose prices change at the most glacial pace. The Atlanta Fed Sticky CPI (Figure 1) helps us to do that. The average item in the CPI basket changes price about once every four months. Around this average there is a big distribution, however: fresh tomatoes change price most often, about once every two weeks; coinoperated launderettes change price least often, roughly once every seven years.
The Atlanta Fed Sticky CPI is a sub-basket of only those items which change price rarely. As can be seen in Figure 1, this has been moving up, and has even flirted with the inflationary zone, determined by the amber upper line. But it is also true to say it has not yet pushed up meaningfully above the levels it stood at prior to Covid. We continue to monitor closely.
Figure 1. Atlanta Fed Sticky CPI
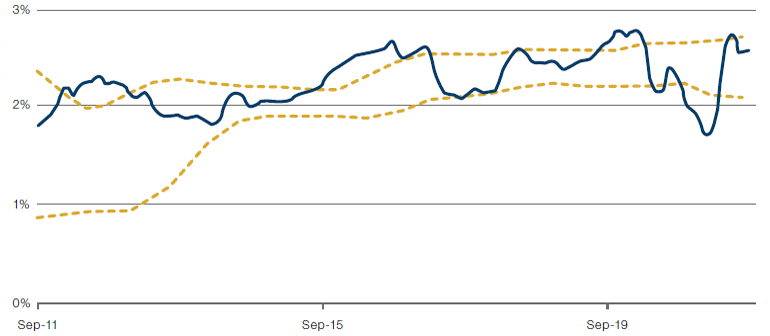
Source: Federal Reserve Bank of Dallas, Federal Reserve Bank of Cleveland, Federal Reserve Bank of Atalanta, Man Solutions; as of 7 October 2021.
Note: Amber dashed bands are moving averages +/- 1 standard deviation on a 3-year lookback.
ESG Performance: For Every Action…
For every action, there is an equal and opposite reaction.
As we’ve previously written, a surge in post-pandemic energy demand, lower renewable energy output and storage, coupled with supply chain issues have driven energy prices significantly higher in 2021 (Figure 2). The higher energy prices have resulted in a run-up in ‘brown’ stocks, which has led to weak returns of the Environmental pillar of the Man Numeric ESG Model (Figure 3).
In contrast, returns to the Social and Governance pillars have been positive. We don’t find this surprising; since there is a strong link between environmental scores and energy and commodity prices. In contrast, Social and Governance metrics are more diverse in the themes incorporated in the signal – human capital, product safety, corporate purpose, executive compensation.
Ultimately, investors have remained undeterred by the surge in “brown stocks”. Flows to ESG smart beta products have remained strong (Figure 4).
Figure 2. Energy and Carbon Credit Prices
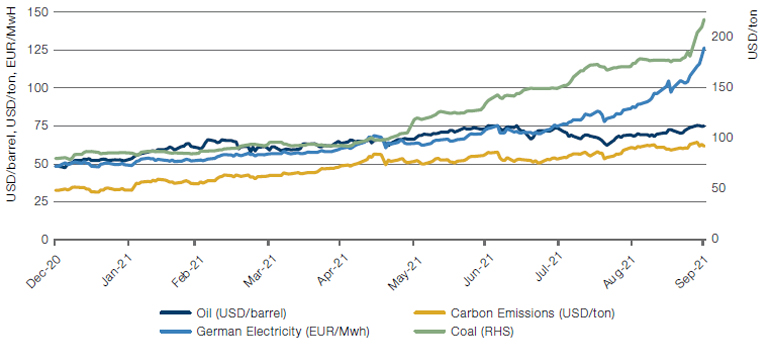
Source: Bloomberg; as of 30 September 2021.
Figure 3. ESG Spreads
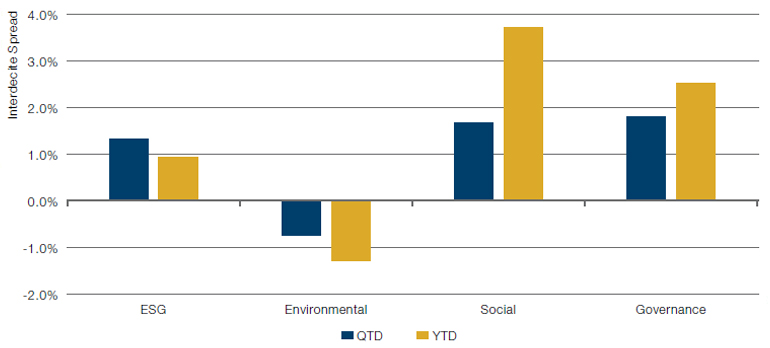
Source: Man Numeric; as of 30 September 2021.
Note: All model spread performance shown is gross-of-fees and does not represent the performance of any Man Numeric portfolio or product. Past performance does not guarantee future results. Returns may increase or decrease as a result of currency fluctuations. The model spreads shown are interdecile, where we invest in the top and bottom 10% of ranked names (rankings based on Man Numeric’s internal alpha scores) and display the gross return. These spread returns are instantaneously rebalanced, sector-neutral and do not reflect transactions costs.
Figure 4. ESG Smart Beta Flows
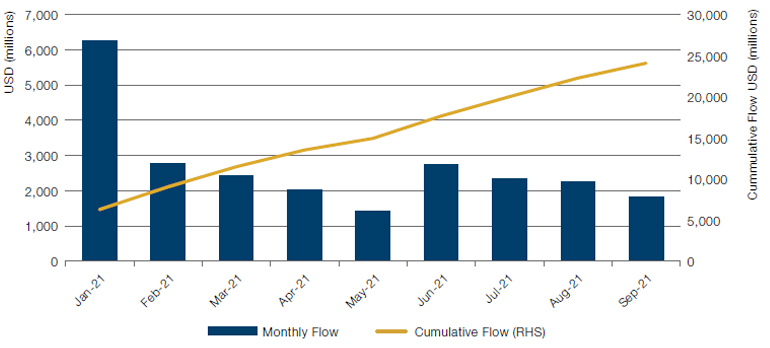
Source: Bloomberg; as of 30 September 2021.
Low Rates, Low Vol and the Profitability Comeback
Low volatility strategies have struggled since the onset of the incredible rally in global markets which began in March 2020. It is not a surprise that investors have started to question the performance of low volatility in a market which is heavily dominated by central banks’ policies. Few would argue that the Covid-19 stimulus that flooded the markets did not distort the risk-reward balance. Indeed, the risks in the market have only been exacerbated by the policy actions of central banks, in our view. However, the stimulus will eventually wane, tightening will start, central banks will raise rates and the euphoria will turn over.
Low volatility stocks are typically companies with stable and profitable businesses. They are thus naturally very different to the high-flying technology and growth companies which promise to disrupt the future. While these potential disruptors may offer a chance to multiply your investment numerous times, low volatility stocks aim to deliver a smoother ride over the long-term with protection of capital. The current booms in electric vehicles, cryptocurrencies and tech and meme stocks are only a few signs of the strong element of speculation that we see in today’s markets. It is not a surprise that the low volatility style has lagged the broader market in such a period of frenetic price discovery. It is imperative to remember that low volatility strategies have higher tracking errors, a cost that investors must pay for lower risk. A higher tracking error also means that there can be periods when the deviations from the market would be comparatively large. When volatility is high, and prices are going up, underperformance in low vol is therefore to be expected.
However, while low volatility strategies are currently experiencing pain, from an earnings perspective, they are doing very well. Since March 2020, Profitability exposure in low volatility stocks has jumped significantly. Looking at the long-short Profitability spread in stocks ranked using MSCI Barra Inverse Global Beta, the exposure to the Profitability factor for low volatility strategies has been near all-time highs (Figure 5). We know that low volatility returns are often connected to the performance of fundamentally oriented factors such as Value and Momentum. We take comfort in the fact that low volatility is correlated to Profitability during a time when the market remains near all time highs. If and when the market turns, low vol may be strongly positioned to capitalise.
Figure 5. Profitability Exposure − Global Low Volatility Universe
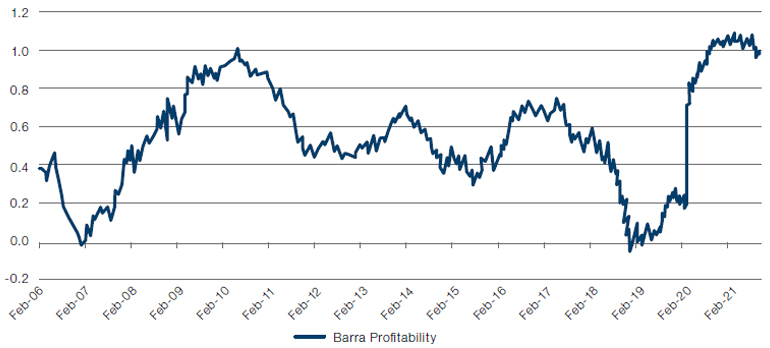
Source: MSCI Barra, Man Numeric; as of 14 October 2021.
With contributions from: Peter van Dooijeweert (Portfolio Manager – Man Solutions), Henry Neville (Analyst – Man Solutions), Robert E. Furdak (CIO for ESG – Man Group) and John Lidington (Client Portfolio Manager – Man Numeric)
You are now leaving Man Group’s website
You are leaving Man Group’s website and entering a third-party website that is not controlled, maintained, or monitored by Man Group. Man Group is not responsible for the content or availability of the third-party website. By leaving Man Group’s website, you will be subject to the third-party website’s terms, policies and/or notices, including those related to privacy and security, as applicable.