The Lamps Are Costing More All Over Europe
The carbon price on EU Emissions Trading System (‘ETS’) reached EUR62 per tonne of CO2 equivalent on 9 September, a record high (Figure 1).
Not surprising, then, that the cost of energy in Europe is also at record highs, bar the Nordics (Figure 2). This isn’t just the fault of the rising price of carbon: the prices of natural gas and coal have also risen sharply (Figure 3).
However, the rise in carbon prices is undoubtedly a contributing factor, with cost of emissions permits adding to the overall cost of extraction for European energy firms. A further factor is Europe’s reliance on natural gas imports in its energy mix. Indeed, much of the continent has no nuclear power generation; and of the countries that do, some are in the process of rejecting it (for example, Germany is set to close all of its 17 nuclear power plants by 2022).
As a relatively clean alternative, we are reliant on natural gas to power the economy through its transition to renewable energy. In our view, the rise in the gas price will have a profoundly negative impact in climate terms. While we acknowledge that the coal price has also risen, this increase has been less precipitous. As such, there is likely to be a substitution effect as producers replace expensive gas with cheaper coal. Likewise, expensive electricity prices will delay the adoption of cleaner technologies such as electric vehicles, as consumers opt to stick with cheaper petrol and diesel alternatives.
We are not yet in a situation where energy prices are such that the lamps are going out all over Europe. But they certainly will cost more – and are likely to delay the energy transition in the process.
Problems loading this infographic? - Please click here
Source: Bloomberg; as of 9 September 2021.
Figure 2. European Power Prices (EUR/MwH)
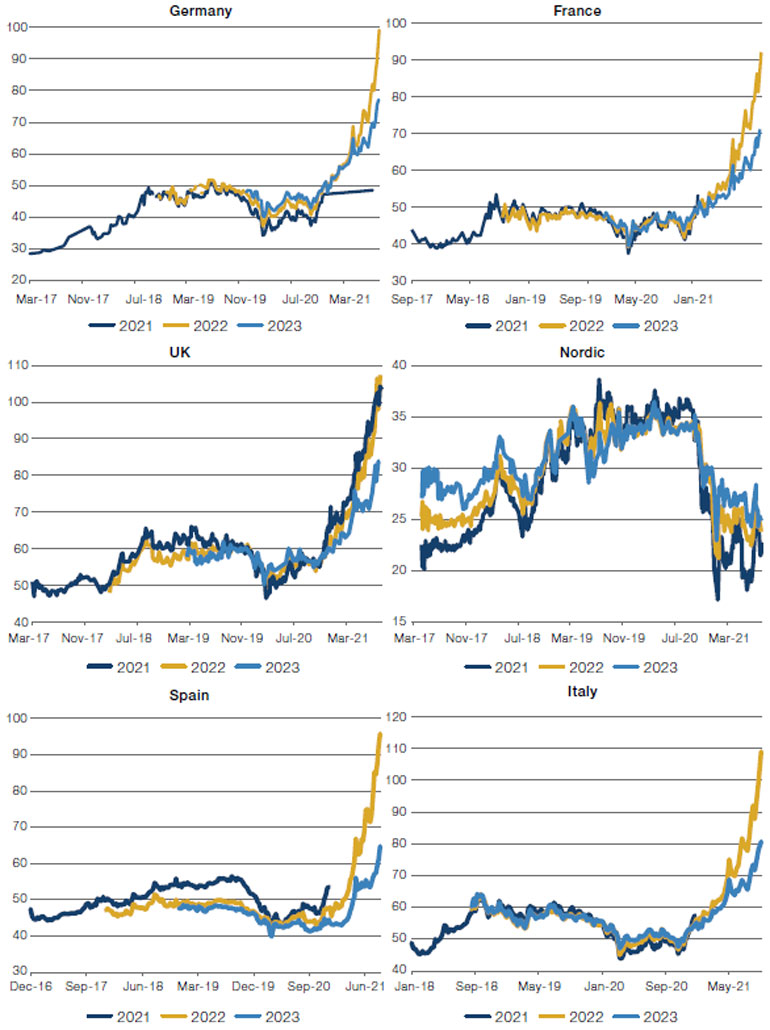
Source: Bloomberg; as of 13 September 2021.
Problems loading this infographic? - Please click here
Source: Bloomberg; as of 9 September 2021. Rebased to 100 as of 1 January 2021.
Earnings Revisions: Past the Peak
Back in August, we wrote about how earnings revisions (the ratio of earning upgrades to downgrades) were in a sweet spot: the 3-month change in the earnings revisions ratio was positive and its absolute level was above zero. In terms of 1-, 3- and 6-month forward returns, our analysis indicates that this was the best possible scenario, at both the index level (MSCI ACWI), and for the outperformance of cyclical stocks versus defensives.
We are now moving to a less positive part of the cycle: even though the absolute level is still very positive, earnings revisions are rolling over (Figure 4). Ultimately, all revisions cycles exhaust themselves, as bullish expectations become too elevated, and outcomes disappoint against a higher bar.
This situation bodes reasonably well in the short term at the index level, with the MSCI ACWI’s 1- and 3-month forward returns holding up (Figure 5). However, there is a sharp drop off in 6-month forward returns. Conversely, returns turn negative for cyclicals versus defensives. While the picture is far from bleak, history would suggest we are no longer in the sweet spot.
Figure 4. Earnings Revision Ratio
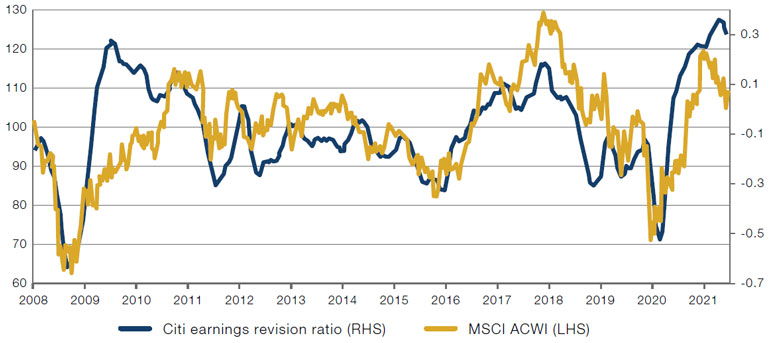
Source: Bloomberg, MSCI; as of 7 September 2021.
Figure 5. Conditional and Unconditional Forward Returns
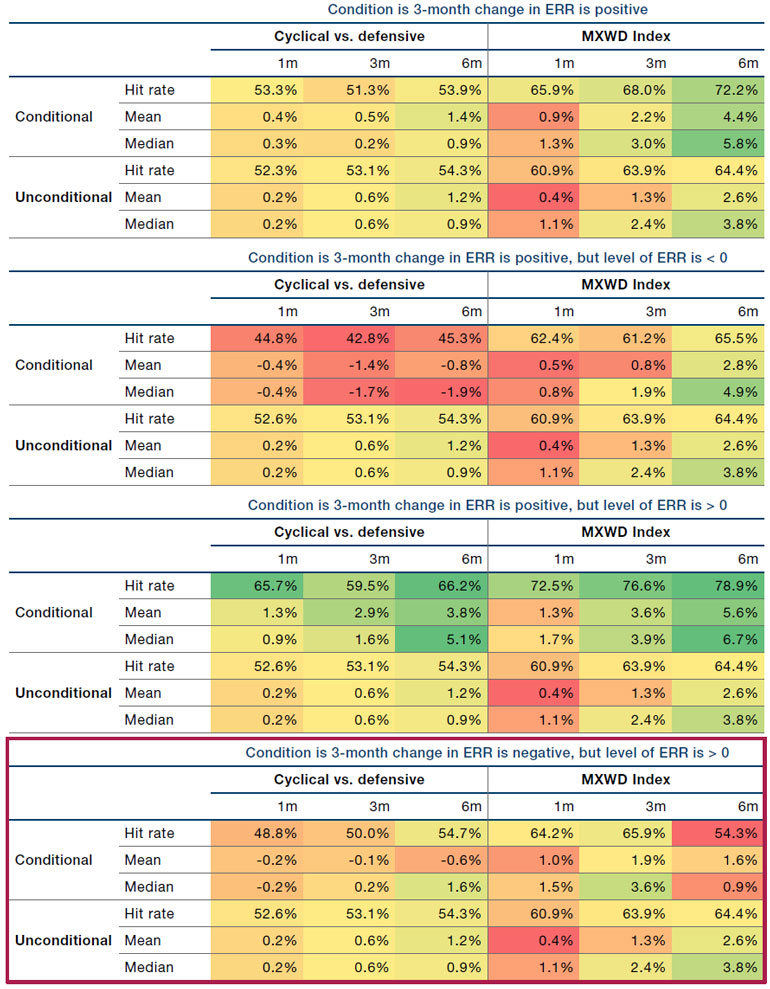
Source: Man GLG; as of 7 September 2021.
With contributions from: Firmino Morgado (Portfolio Manager, Man GLG) and Ed Cole (Managing Director - Discretionary Investments, Man GLG).
You are now leaving Man Group’s website
You are leaving Man Group’s website and entering a third-party website that is not controlled, maintained, or monitored by Man Group. Man Group is not responsible for the content or availability of the third-party website. By leaving Man Group’s website, you will be subject to the third-party website’s terms, policies and/or notices, including those related to privacy and security, as applicable.